Explore Jobs
- Jobs Near Me
- Remote Jobs
- Full Time Jobs
- Part Time Jobs
- Entry Level Jobs
- Work From Home Jobs
Find Specific Jobs
- $15 Per Hour Jobs
- $20 Per Hour Jobs
- Hiring Immediately Jobs
- High School Jobs
- H1b Visa Jobs
Explore Careers
- Business And Financial
- Architecture And Engineering
- Computer And Mathematical
Explore Professions
- What They Do
- Certifications
- Demographics
Best Companies
- Health Care
- Fortune 500
Explore Companies
- CEO And Executies
- Resume Builder
- Career Advice
- Explore Majors
- Questions And Answers
- Interview Questions

25+ Essential Business Travel Statistics [2023]: How Much Do Companies Spend On Business Travel

- Business Travel Statistics
- Small Business Lending Statistics
- B2B Statistics
- How many businesses accept bitcoin
- What percentage of small businesses fail?
- What percentage of small businesses have a website?
- Hybrid Working Statistics
- Small Business Statistics
- Coworking Statistics
- Online Review Statistics
Research Summary. Whether you’re flying out of town for that important business meeting or simply attending an annual workshop, business travel is an important part of any big company’s protocol. When it comes to business travel, our extensive research shows that:
Business travel in the U.S. from domestic and international travelers amounts to around $387 billion in annual revenue .
While business trips currently account for roughly 12% of total U.S. air travel , they make up to 75% of airlines’ profits .
At least 35% of U.S. businesses engage in business travel.
From 2019-2020, the number of business trips taken in the U.S. dropped from 464 million to 185 million .
The average business trip costs Americans $949 in travel fees .

General Business Travel Statistics
Knowing that business travel accounts for up to 75% of air travel revenue, it’s not hard to see why it’s encouraged. In fact, business travel is so lucrative that it even affects the U.S. GDP. Here are the facts:
In 2016 alone, business travel contributed $547 billion to the United States’ total GDP.
That’s around 3% of the total GDP, a number which stayed rather stable until 2020 when the COVID-19 pandemic negatively affected business travel. In reality, these high numbers might never return, as experts predict 36% less business travel post-COVID.
In 2022 business travel accounted for 12% of U.S. air travelers.
In 2022 there were over 460 million business travelers, which is a noticeable increase from 2020’s drop to 185 million. However, both years have had a relatively even share of business travelers (around 12-13%).
Business travel can account for up to 75% of an airline company’s revenue.
This trend can mostly be attributed to the booking of first-class tickets. Instead of saving money on business trips, more and more corporations are looking to provide their travelers with maximum comfort and convenience. While doing so makes the company look better, these decisions are mostly made due to competition.
Business travelers account for as much as 40% of hotel guests.
63% of these travelers are male, and 50% are between 35-54. Further, 56% of these individuals are employed in a professional or managerial position that earns them at least $127,000 per year.

Business Trip Statistics
Now that we know how profitable and common business trips are in the U.S., what does the average business trip look like? Well, according to our extensive research:
The average length of a domestic business trip in the U.S. is three days.
The average length for an international trip is 5-6 days. Overall, these numbers seem to slowly decline over time, with the old average (2016) for international business trips being just over six days.
Roughly 26% of business trips are only one day long.
This is another contributing factor for companies’ high cost of business trips, as same-day flights can wrack up costs. However, this does save the company money elsewhere (lodging, food, etc.).
38% of U.S. business travel is for meetings and events.
ME&I travel ( meetings , events, and incentive travel) amounts to $139.3 billion of all business travel spending, nearly 42% of total business travel spending.
Roughly 1.3 million business trips are taken in the U.S. every day.
A number that took a hit from the 90% reduction in travelers in 2020. While these numbers may not recover to pre-COVID numbers, 2021 has increased.
Business Travel Spending Statistics

As shown, a good percentage of businesses invest in business travel despite the cost. However, you might be surprised to learn just how much business travel costs companies and employees. According to our extensive research:
The average three-day domestic trip costs between $990-$1,293.
While the average international trip costs an average of $2,600 or more. For this reason, business trips need to be especially valuable for the company or employee taking them.
The average company spends 17-27% of its total travel budget on airfare.
You might be surprised to learn that airfare isn’t the most expensive part of business travel. Overall, the average domestic flight is $470, give or take how far away the destination is.
Over 20% of a typical business travel budget goes to food expenses.
That’s even more than flights and can amount to hundreds of dollars in expenses. One of the best ways to avoid this hefty cost is to utilize free hotel breakfasts. After all, never buying breakfast is a great way to cut food expenses.
The most expensive aspect of a business trip is lodging, making up around 34% of total costs.
Hotels make a lot of money from business travelers and the companies who sponsor their trips. This is especially true given the fact that up to 40% of hotel guests are business travelers.
Companies spend roughly $799 per person per day during a business trip.
Business Traveler Statistics
Because only 35% of companies actively partake in business travel, and it can be rather expensive, the demographics of travelers can be rather skewed. According to our research:
At least 50% of business travelers are between 35-54.
Undoubtedly, this abundance of higher ages relates to an employee’s position within the company. Older workers are more likely to have high-level positions . This can also be shown by the fact that 56% of business travelers hold professional or managerial positions that earn at least $127,000 per year.
The average business traveler takes roughly 6.8 trips per year.
And this number is even higher for millennials , who take an average of 7.4 trips per year. In that way, younger generations take more business trips on average (per person) than their older counterparts.
47% of female travelers are traveling on business.
While female business travelers are slightly less common than male travelers, women (on average) tend to enjoy their trips more than their male counterparts. Overall, 45% of women have positive experiences while traveling on business compared to 39% of men.
As of 2021, only 12% of corporate travel representatives feel as though their employees are unwilling to travel.
And with new CDC travel guidelines in 2021, 61% of employees now feel somewhat more comfortable traveling for business.
It takes an average of 38 minutes to complete and correct one expense report.
While it only takes 20 minutes (on average) to complete the expense report , at least 19% of expense reports have errors. Plus, with an average of 1.5 travel expense reports filed per month, that means employees can spend up to an hour filing them each month.
Business Travel Company Policy Statistics
Due to the potentially expensive nature of business travel, it’s no surprise that companies create business travel policies. Here are some stats related to business travel policies:
72% of corporate travel managers haven’t achieved their desired travel policy compliance level.
For the most part, this lack of compliance is due to shortfalls in the traveler ’s experience, fairness and transparency, and not meeting budget requirements.
Only 50% of business travelers follow their company’s travel policy.
In fact, 60% of business travelers don’t even understand their company’s travel policy, making it especially difficult to follow.
81% of business travel is done via personal vehicle.
By contrast, only 16% of business travel is air travel . That means most business travelers travel to their destination by car.
90.6% of corporate travel managers agree that business travel is vital for company growth.
And this sentiment comes from a genuine place, as on average, businesses earn a $2.90 increase in profit for every dollar spent on corporate travel. That equates to an average $9.50 increase in revenue.
Business Travel Trends and Projections
The 2020 height of the COVID-19 pandemic took a major toll on business travel. While business travel has started to recover in 2021, the number of travelers is still around half of what it was pre-COVID. After extensive research, here are the facts about business travel trends:
From 2019-2020, the number of business travelers in the U.S. dropped from 464 million to only 185 million.
From 2010 to 2019, business travelers remained steady between 440 million and 465 million. However, this number dropped drastically in 2020 and then increased to 229 million in 2021.
From 2010-2019, the number of business travelers grew by 4%.
However, the COVID-19 pandemic saw the number of business travelers decrease by 60%, which aligns with other travel declines caused in 2020.
The business travel industry is expected to experience a CAGR of 13.2% between 2021 to 2028.
Luckily, trends seem to show that business travel will start to recover from the COVID-19 pandemic over the next couple of years. Estimates predict that the value of the industry will increase from $695.9 billion in 2020 to $2.1 billion by 2028.
Business Travel FAQ
How many people travel for business annually?
Over 460 million people travel for business annually in the U.S. This is a massive 150% increase from 2020 when there were only 185 million, and similar to 2019’s numbers.
For instance, from 2019-2020, the number of business travelers dropped by 60%. This is mostly due to COVID-19, which affected the travel industry with restrictions and regulations through 2021.
What types of businesses travel the most?
The types of businesses that travel the most are as follows:
Sales Representative
Retail Buyer
Event Planner
Traveling Nurse
International Aid Worker
Civil Servant
Travel Writer
Travel Agent
Flight Attendant
These jobs are all related to or require business travel in one way or another. However, it’s also worth noting that 56% of business travelers hold professional or managerial positions that earn at least $127,000 per year.
How big is the business travel market?
The business travel market is worth an estimated $933 billion as of 2022. From 2020 to 2021, the market rebounded by 14%, from where it had previously dropped to $695 billion. Overall, the business travel market is expected to experience a CAGR of 13.2% between 2021 to 2028.
What percent of travel is business travel?
Approximately 12% of U.S. travel is business travel as of 2022. That number is slightly down from 13.6% in 2021, but half of what it was pre-COVID. For instance, in 2019, business travelers made up at least 25% of all travelers.
How much do companies spend on business travel?
Companies spend over $111.7 billion each year in the U.S. on business travel. Per company, travel costs typically equate to roughly 10% of that company’s annual revenue.
Business travel is an important investment for industries and companies all over the United States. That’s why, despite it costing them between $990-$1,293 per trip, they still choose to send employees on them. In fact, pre-COVID, at least 25% of U.S. travelers were business travelers.
These travelers tend to fall under certain demographics, with at least 50% of business travelers between the ages of 35-54 and 56% of business travelers holding professional or managerial positions that earn at least $127,000 per year.
However, COVID-19 took a heavy toll on the industry. The number of domestic business travelers dropped from 464 million to 185 million (25% to 13%). This job has affected airliners, hotels, the food industry , and more. Luckily, the business travel industry has a CAGR of 13.2% between 2021 and 2028, which indicates at least somewhat of a rebound.
Global Business Travel. “Business Travel Responsible for $547 Billion in U.S. GDP in 2016, Creates Over 7.4 Million Jobs.” Accessed on December 8th, 2021.
Statista. “Number of domestic business and leisure trips in the United States from 2008 to 2019, with a forecast until 2024.” Accessed on December 8th, 2021.
Investopedia. “How Much Airline Revenue Comes From Business Travelers?” Accessed on December 8th, 2021.
AHLA. “Lodging Industry Trends 2015.” Accessed on December 8th, 2021.
Travel Leaders Corporate. “09 Nov Travel Leaders Corporate Releases Q3 Business Travel Trends Data.” Accessed on December 8th, 2021.
U.S. Travel Association. “U.S. Travel Answer Sheet.” Accessed on December 8th, 2021.
Bureau of Transportation. “U.S. Business Travel.” Accessed on December 8th, 2021.
GBTA. “U.S. Business Travel – By The Numbers.” Accessed on December 8th, 2021.
TravelBank. “How Much Should a Business Trip Cost?” Accessed on December 8th, 2021.
JTB. “Important Business Travel Statistics.” Accessed on December 8th, 2021.
Trondent Development Corp. “Business Travel by the Numbers.” Accessed on December 9th, 2021.
GTI Travel. “What do Female Business Travelers do Differently from their Male Counterparts.” Accessed on December 9th, 2021.
Hotel Management. “GBTA poll finds positive momentum for business travel.” Accessed on December 9th, 2021.
SAP Concur. “Save time and money on expense report processing.” Accessed on December 9th, 2021.
TravelPerk. “5 reasons why traveler satisfaction is the key to a successful travel program.” Accessed on December 9th, 2021.
Cision. “Business Travel Market Size to Reach USD 2,001.1 Billion by 2028 at CAGR 13.2% – Valuates Reports.” Accessed on December 9th, 2021.
Certify. “Understanding the average cost of business travel.” Accessed on December 9th, 2021.
Travel jobs statistics
Zippia ’s research team connects data from disparate sources to break down statistics at the job and industry levels. Below you can dig deeper into the data regarding employees who work in travel or browse through Transportation jobs .
Overview | Jobs Salary
Browse Transportation Jobs
How useful was this post?
Click on a star to rate it!
Average rating / 5. Vote count:
No votes so far! Be the first to rate this post.

Jack Flynn is a writer for Zippia. In his professional career he’s written over 100 research papers, articles and blog posts. Some of his most popular published works include his writing about economic terms and research into job classifications. Jack received his BS from Hampshire College.
Recent Job Searches
- Registered Nurse Jobs Resume Location
- Truck Driver Jobs Resume Location
- Call Center Representative Jobs Resume Location
- Customer Service Representative Jobs Resume
- Delivery Driver Jobs Resume Location
- Warehouse Worker Jobs Resume Location
- Account Executive Jobs Resume Location
- Sales Associate Jobs Resume Location
- Licensed Practical Nurse Jobs Resume Location
- Company Driver Jobs Resume
Related posts

30+ Powerful Pet Industry Statistics [2023]: Trends, Facts, And Market Projections
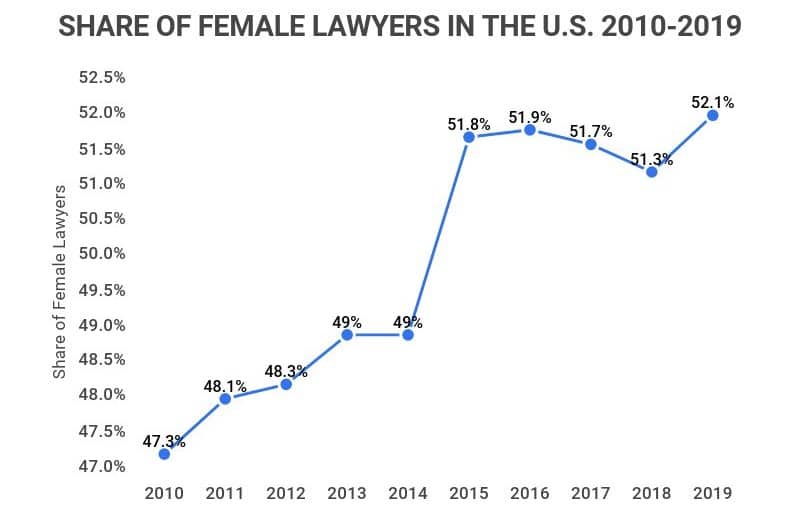
What Percentage Of Lawyers Are Female?

25+ Striking U.S. Film Industry Statistics [2023]: Facts About The Video Production Industry In The U.S.
23 Recruitment Statistics [2023]: What HR Professionals And Hiring Managers Need To Know
- Career Advice >
42 Business Travel Statistics That Will Inspire You to Hit the Road
By Danica Jovic
February 6, 2024
People enjoy traveling. Indeed, they like it so much that most don’t care if they need to send a few emails, attend meetings, or listen to seminars during their trip. Work hard, play hard – that’s the motto of business travelers, who are happy to endure a morning full of meetings if it means they can spend the afternoon sipping margaritas in the sun.
Business travel statistics show that about 30% of job seekers are ready to accept lower-paid jobs if they include business trips. Companies are aware that employees enjoy these “bleisure” trips, and are in many cases willing to make them more comfortable with a lot of money for travel spending, accommodation, meals, and transportation. We’ve compiled the following stats and facts to show just how popular business travel has become.
Editor’s Choice: Business Travel Statistics
- Global business travel statistics from 2017 show that during that year, $1.33 trillion was spent on business travel worldwide.
- Globally, annual business travel costs are expected to amount to $1.7 trillion by 2022.
According to the Global Business Travel Association, 1.3 million business trips are taken in the US every day.
- Almost 10% of business trips can be categorized as “bleisure” trips.
Although business travel is on the rise, only 60% of companies actually have a corporate travel policy.
General business travel statistics.
Even though we live in a telecommunication-dominated era, face-to-face business meetings are still essential for building stable and continuous relationships with clients. No matter how easy it is for workers to make a conference call, communicate with colleagues via Skype, or attend a webinar from the comfort of your own office, companies still organize business trips for employees. In fact, the business travel economy has grown rapidly since the Great Recession, with spending reaching $1.6. trillion in 2020.
The latest US business travel statistics show that US travelers took over 463 million business trips inside the US in 2018.
While business travelers account for only 12% of flight tickets, they generate roughly twice as much money per person for airlines as non-business customers..
(Investopedia)
Global business travel statistics from 2017 show that $1.33 trillion was spent on business travel worldwide during that calendar year.
(Global Business Travel Association)
Annual global business travel costs are set to rise to $1.7 trillion by 2022, according to what was then the National Business Travel Association.
Two-thirds of business travelers believe it’s difficult to build a working relationship via video calls..
(Skift and TripActions)
Global Business Travel Statistics
International business travel statistics show that the US and China are the global leaders when it comes to business travel spending, followed by India, Indonesia, and Sweden. You probably won’t be surprised to learn that the most expensive cities for taking business trips are New York and the two largest Swiss cities: Zurich and Geneva. However, while most countries are spending more on business travel, the UK is going backward; there was a 3% decline in outbound business trips in 2018 due to concerns about Brexit.
China has the largest business travel market, with total spending amounting to $346.5 billion in 2017.
India (11.3%) and indonesia (8.7%) are the two countries with the fastest-growing business travel markets., new york city is the most expensive city for business travel, with daily costs adding up to ($799), followed by geneva, ($716 per day), zurich ($661 per day), washington dc ($621 per day), and paris ($617 per day)..
(ECA International)
Hong Kong remains the most expensive city in Asia for business travel, with an average daily cost of $515.
In total, more than $50 billion was spent on business travel in the uk in 2017., from 2017 to 2018, there was a 3% decline in outbound business trips from the uk. in fact, since 2016, the outbound traffic rate has dropped steadily due to concerns about brexit., american travel statistics for business.
American companies understand the importance of investing in business travel. Whether for meetings, educational events, or conferences, Americans spend a lot of time and money on both personal and group business trips.
This spending is particularly heavy on the west coast. Indeed, the annual number of inbound business trips to the west is 7.5 million higher than those heading from the west to other parts of the country.
By 2022, there will be nearly 500 million business trips per year within the US.
In the us, nearly $328 billion was spent on international and domestic business trips in 2018..
(US Travel Association)
Predictions suggest that North America will lose 1% of global business travel market share by 2022.
There are about 64 million inter-regional trips in the us every year, statistics about traveling show..
(US Department of Transportation)
The west is America’s most popular region for business trips; annually, it attracts nearly 7.5 million more inter-regional business trips than it sends away. Every year, the south hosts 7.7 million fewer inbound inter-regional business trips than outbound ones.
26% of all business trips are one day long, according to international travel statistics..
(Associations Now)
Business Traveler Demographics
If you’re wondering who makes these trips, the answer is not as straightforward as you might think. Men aged between 30 and 49 form the majority of the business travel population, but the number of women who travel for business is growing rapidly.
Travelers are growing up quickly too; 40% of millennials now travel for work, and many choose jobs specifically because of the opportunity to travel. Most millennials who travel extend their business trips to visit other cities.
According to Bureau of Transportation statistics, 77% of people traveling for work are men.
Although some sites claim that 47% of business travelers are women, according to the american travel bureau, the actual proportion of women travelers is just 23%., more than half of all business trips are taken by people aged 30 to 49., millennial business travelers – stats and facts.
Millennials have now reached the age when they’re starting to rise to important positions in the workplace. They’re also known for valuing work-life balance perhaps more than any previous generation. That’s why it’s no surprise that millennials are strongly represented in business travel statistics.
Nearly 40% of millennials travel for business.
(American Express)
Nearly two-thirds of young workers and millennials see business trips as a status symbol.
(Hilton Hotels & Resorts)
Travelers aged 18 to 29 take 16% of all business trips.
55% of millennials prefer to prolong their business trips in order to have more time to experience new places and learn new things., business travel costs.
Business travel isn’t cheap. Indeed, when you take into account transportation, accommodations, food, and attendance at seminars, the costs add up. And most companies don’t choose cheap travel options. Companies spend a lot of money on business trips in order to provide the best experience to their employees.
The average cost of business travel per day in the US is $325.
(Business Travel News)
On the average business trip, companies spend $1,217 for international round-trip tickets and $470 on domestic business tickets.
(JTB Business Travel)
For every trip, US businesses spend nearly $950 per traveler who travels inside the US, while the average cost for an international business trip is $2,600 per person.
Us businesses spend $31.6 billion on international travel every year., typically, companies’ business traveling budgets are distributed like this: meals (21%), flights (17%), miscellaneous expenses (17%), and accommodation (13%)., 5% of total business travel costs go toward cell phones, while only 3% are spent on taxi services., if you’re organizing a business trip to new york, you should budget $145 for three meals a day. however, in nashville, you’ll need to budget only $76.50., business travel transportation facts.
You might be surprised to learn that most of America’s business trips are made by car. Americans prefer to travel in their private vehicles when possible.
About 405 million long-distance business trips are made each year in America, according to US travel statistics.
81% of all business trips are taken by car, while 16% are taken by plane., distance plays an important role in determining which mode of transport should be used; 97% of short trips (50 to 90 miles) are taken by vehicle., the world’s most expensive travel lounges are in these airports: dubai ($329/person), london city ($157/person), and london heathrow ($67/person)., bleisure travel statistics.
Work hard, play hard – this is the philosophy many business travelers now live by. “Bleisure” is a portmanteau that means exactly what you think it means: corporate trips that consist of both business and leisure. Just ask freelancers or remote workers, many of whom have taken bleisure to be their new lifestyle. The average corporate traveler in the USA lives the bleisure lifestyle by extending business trips so they can visit new cities and interact with different cultures.
Almost 10% of business trips can be categorized as bleisure trips.
Nearly 60% of businesses support bleisure trips by encouraging employees to extend their business trips., nearly 50% of business travelers extend their trips to visit other countries or cities..
(Booking.com)
More Business Travel Statistics and Facts
Nowadays, people are willing to take lower-paid jobs if they include business trips as a perk. While some companies don’t support “shared economy services” like Airbnb and Uber, statistics show that most American business travellers prefer these types of services.
Traveling for work is the main reason about 30% of people would choose a lower-paying job.
(Finance Online)
40% of business travelers don’t follow their companies’ travel policies. Instead, they make their hotel reservations on their own.
(Skift and Turkish Airlines)
15% of total Airbnb bookings come from business travelers.
What percent of travel is for business.
Business trips make up about 12% of total air travel. However, thanks to business class fares, they typically generate twice as much money for airlines as regular trips.
How many people travel business each year?
According to US statistics on traveling, 405 million long-distance business trips are taken each year.
What businesses travel the most?
With younger generations – especially millennials – looking for more dynamic jobs, more and more companies are ready to organize regular business trips for their employees. In general, sales representatives, consultants, and travel agents tend to travel most often. Professions like programming and accounting are typically thought of as desk jobs, but nowadays even those workers are getting the chance to attend trips and conferences.
What age group travels the most?
People between 30 and 49 travel the most for business, and most of those travelers are men. However, the number of women of all ages traveling for business is increasing. About 40% of millennials travel for business.
How long is the average business trip?
Business trips are typically quite short. On average, 26% of business trips are only one day long. Of course, many people like to combine business and leisure by extending their business to visit other places, according to the latest business travel statistics.
- American Express
- Booking.com
- ECA International
- Finance Online
- Global Business Travel Association
- Investopedia
- Skift and TripActions
- US Department of Transportation
- Associations Now
- Business Travel News
- Hilton Hotels & Resorts
- JTB Business Travel
More From Our Blog
Startup failure rate and 80+ other startling statistics about startups, under the influence – 80+ influencer marketing statistics (infographic), 41 small business statistics: everything you need to know, leave a comment cancel reply.
Your email address will not be published. Required fields are marked *
Save my name, email, and website in this browser for the next time I comment.
Ready to simplify your receipt and expense management process?
Enter your email to sign up for Expensify today!
40+ business travel statistics to know before you book

Whether you're a seasoned business traveler or preparing for your maiden corporate voyage, staying up-to-date with key business travel data is crucial. Making informed decisions based on relevant stats can save you not just time and money but also the occasional travel-induced headache.
To help you stay in the loop, we’ve compiled over 40 business travel statistics, ranging from the average business trip cost to the rise of “bleisure.” Let's dive in and see how they can impact your next business trip.
Statistics on the cost of business travel
Ever wondered what the price tag on a typical business trip looks like? Curious about what could land your expense report in the red? You're about to get a clear look. We've dug into the numbers to bring you the average costs for business trips, both within the U.S. and beyond its borders.
1. The average business trip cost in the U.S. in 2023 was reported to be $1,293 , with the daily cost being $325 . [1]
2. For international trips, the average cost in 2023 was $2,600 per traveler. [1]
3. In comparison, the average cost of a domestic business trip in the U.S. in 2019 was $990 , while international business trips averaged $2,525 , showing us that business travel costs are on the rise. [2]
4. On average, companies spend 17%-27% of their total travel budget on airfare. [3]
5. More than 20% of a business travel budget is allocated toward covering food expenses. [3]
6. Lodging makes up around 34% of the total cost of business travel. [3]
7. While business trips constitute about 12% of total U.S. air travel, they contribute up to 75% of airlines’ profits. [4]
8. The overall budget for business travel in 2023 is expected to reach 98% of the levels seen in 2019 , showing a recovery trend. [5]
Business travel safety stats
As companies globalize and work trickles beyond geographical boundaries, ensuring the safety and security of traveling employees is more important than ever. In this section, we’ll unveil statistics highlighting common safety concerns of global business travelers.
9. 46% of those who travel for work don’t have a corporate travel safety plan . [6]
10. 73.2% of travelers are concerned about delayed flights. [7]
11. Out of a group of European business travelers surveyed in 2018, 53% were impacted by terrorism. [8]
12. 49% of travelers surveyed were impacted by political or social unrest. [8]
13. 28% of travelers surveyed were impacted by tropical diseases. [8]
14. 25% of travelers surveyed were impacted by crime. [8]
15. Only 44% of employees surveyed stated that their employers organized travel risk awareness training. [8]
16. 83% of female business travelers have safety concerns, indicating the need for gender-specific guidance and resources in business travel safety training. [6]
Business travel destinations: facts and figures
Let’s uncover the go-to destinations for business travelers and delve into the spending trends associated with them. We've sifted through the data to bring you some eye-opening stats on the top countries for business travel and the biggest financial cities across the globe.
17. The most visited countries for international tourism, which includes business travel, are France , Spain , and the U.S. [9]
18. The most expensive states for business travel were identified as Hawaii , Massachusetts , and California . [1]
19. New York City was reported as the most expensive city for business travel, with daily costs averaging $799. Geneva was next ( $716 per day ), followed by Zurich ( $661 per day ), Washington D.C. ( $621 per day) , and Paris ( $617 per day ). [10]
20. Italy registered nearly 15 million international business travel arrivals in a recent year. [11]
Breaking down the demographics of business travelers
A diverse group of people travel for work, each with unique characteristics and preferences. This section aims to provide a clearer understanding of today's modern business traveler. Let's peel back the curtain and explore the profiles of those who embark on these journeys.
21. According to the Bureau of Transportation, men make up 77% of those traveling for work. [12]
22. At least 50% of business travelers are between 35-54 years old. [3]
23. 63% of business travelers have a bachelor's degree. [3]
24. The average business traveler takes roughly 6.8 trips per year. This number is higher for millennials, who take an average of 7.4 trips per year. [3]
25. 83% of business travelers see business travel as a positive experience. [12]
26. About 79% of business travelers say that travel improves their overall job satisfaction. [12]
Statistics on business travel sustainability
In the wake of rising environmental awareness, the business travel sector is tuning into sustainability. Companies are curbing air travel, while travelers are becoming more mindful of their carbon footprints. Here’s a glimpse of statistics unveiling how eco-friendliness is reshaping business travel.
27. 55% of companies are cutting down on air travel post-pandemic. [13]
28. 56% of business travelers state that lowering their carbon footprint is a moderate priority, while 21% believe it’s a top priority. [14]
29. Traveling in economy class has half the CO2 footprint of business class, as passengers take up less space. [15]
30. 77% of business travelers stated that they would be willing to forego daily hotel cleanings to reduce their carbon footprint. [14]
31. Nearly half ( 49% ) of companies are developing new climate-friendly products or services, indicating a shift towards sustainability that could include eco-friendly travel solutions and policies. [13]
Data: business travel tech usage
The digital shift is simplifying business travel, making online check-ins, bookings, and post-trip reimbursements a breeze. Below are stats showcasing how tech adoption is refining the business travel experience for travelers and employers alike.
32. 51% of passengers around the world use a smartphone or other device to check in online. [7]
33. 68% of business travelers book their trips through online channels, according to a survey of 1,000+ people in 2018. [16]
34. 57% of business travelers want to have a single application to manage their planning, booking, and reimbursement needs. [7]
35. Only 26% of travel managers claim that their corporate travel booking tool does a good job of accommodating employees with accessibility needs. [14]
36. 37% of travel managers aren’t sure how well their company’s booking tool assists employees with accessibility needs. [14]
The ins and outs of bleisure
"Bleisure" travel — a fusion of business and leisure trips — has been gathering steam in recent years. As the lines between work and leisure blur, especially with the rise of remote work, many are seizing the opportunity to blend business trips with leisure activities. Let’s take a look at what the numbers are saying about bleisure:
37. U.S. business travelers take over 405 million long-haul business trips annually. It is estimated that employees are adding vacation time to around 60% of these trips (243 million). [17]
38. 67% of bleisure trips begin with an agenda to attend a conference, 46% with external meetings, and 42% with sales opportunities. [17]
39. 57% of companies have a policy in place for employees aged 20-30 to extend business trips with vacation time. [18]
40. 17% of bleisure trips stretch over four nights, 31% span three nights, and 39% last for two nights. [17]
41. 35% of bleisure travelers have company during their trips, while 36% plan to visit with family or friends at their destination. [17]
42. 86% of bleisure travelers regard corporate travel as a vital component for career development. [19]
43. 39% of bleisure travelers actively seek job roles that offer business trip opportunities — they’re even open to sacrificing other benefits for more chances to travel. [19]
44. Bleisure trips are linked to efforts to become more sustainable, with 60% of surveyed business travelers reporting that the pandemic has made them more conscious of the environmental impact of traveling. [20]
Enhance your experience: business travel tips
Traveling for business — especially for bleisure — is always exciting. However, the administrative trail of expenses left in the wake of your adventure can often dull the sparkle, especially when it takes ages to get paid back after your business trip.
Let’s break down some tried-and-true business travel tips to ensure your next trip isn’t just fruitful but also enjoyable.
Leverage expense management software: Utilizing expense management software like Expensify is a game-changer for seamless business travel. It automates expense tracking, categorization, and reporting, so you can say goodbye to manual data entry and hello to more free time to explore new cities.
Ditch paper receipts: Paper receipts are easy to lose and a hassle to manage. Thanks to Expensify’s SmartScan technology, you can easily track spend on the road by simply snapping a picture of your receipt, uploading it to Expensify, and carrying on with your day.
Stay connected: Staying connected is key, especially when traveling internationally. Make sure to purchase an international SIM card or a global roaming plan to have a reliable mobile connection to keep in touch with your team and manage work on the go.
Prioritize your well-being: Traveling can disrupt your routine, but it's essential to maintain a healthy lifestyle. Ensure you have a balanced diet, stay hydrated, stick to your exercise routine, and get enough rest to stay productive and enjoy your trip!
Jet-set with confidence: Expensify’s got your back
Armed with these insightful business travel statistics, you're in a great spot to make savvy travel decisions that could lead to significant savings. And with Expensify in your back pocket, you have everything you need to streamline expense tracking and stay on top of your finances while traveling.
With the administrative hassle curtailed, all that's left is for you to pack your bags and jet off on your next business adventure with an air of confidence and ease. Safe travels!
Struggling with receipt tracking on business trips?
Expensify automates receipt scanning, simplifies reports, and gives you real-time insights — even on the move.
Expensify values your privacy. We’ll never sell your personal information to others.

The Average Business Trip Costs $1,293 and Prices Will Increase in 2020, Business Wire
Business Travel Costs Around the World, Expert Market
25+ Essential Business Travel Statistics [2023]: How Much Do Companies Spend on Business Travel, Zippia
How Much Airline Revenue Comes From Business Travelers? Investopedia
2023 Outlook: Business Bounces Back, Morgan Stanley
20 Business Travel Safety Tips and Guidelines for Employees, Alert Media
105 Critical Business Travel Statistics: 2023 Spending & Concerns Analysis, Finances Online
2018 Business Impact of Travel Risks Survey, International SOS
International Travel Statistics: Facts and Trends for 2023, The Broke Backpacker
Hong Kong remains the most expensive location in Asia for business travel, ECA International
Number of international business tourist arrivals in selected countries worldwide in 2019, Statista
25 Impressive Business Travelers Stats 2023 [Facts & Trends], Thrive My Way
Deloitte 2022 CxO Sustainability Report, Deloitte
100+ Business Travel Statistics (2023), Dream Big, Travel Far
Flying and Driving: Can we Travel more Sustainably? ClimateScience
Essential Digital Transformation In Travel Industry Statistics In 2023, Zipdo
77+ Bleisure Travel Statistics, Stratos
How Millennials Are Creatively Approaching Their Business Travel, Forbes
42 bleisure travel statistics for 2023, TravelPerk
The Future of Blended Travel, Crowne Plaza

Lindsey Peckham
A native Bostonian (with a 3-year stint in San Francisco in between), Lindsey now calls London home. She still prefers iced coffee over tea, but has a new soft spot for a Sunday roast. When she’s not working on marketing at Expensify, you’ll most likely catch her spending too much money at the local flower market.
Related Posts

The best expense tracking app for independent contractors

Indirect spend vs. direct spend in your company expenses

Opportunity cost formula + how to calculate it for your business
Better money management = more money to manage..
Get started with Expensify.
- Expense Management
- Spend Management
- Expense Reports
- Company Card
- Receipt Scanning App
- ExpensifyApproved!
- ExpensifyHelp
- Expensify App
- About Expensify
- Expensify.org
- Investor Relations
Get Started
- Create a new account
©2008-2024 Expensify, Inc.
The Expensify Visa® Commercial Card is issued by The Bancorp Bank, N.A. pursuant to a license from Visa U.S.A. Inc. and may not be used at all merchants that accept Visa cards. Apple® and the Apple logo® are trademarks of Apple Inc., registered in the U.S. and other countries. App Store is a service mark of Apple Inc. Google Play and the Google Play logo are trademarks of Google LLC.
Money transmission is provided by Expensify Payments LLC (NMLS ID:2017010) pursuant to its licenses .
- SOFTWARE CATEGORIES
- FOR REMOTE WORK
- Research Center
105 Critical Business Travel Statistics: 2024 Spending & Concerns Analysis

Technology may have opened up new ways for individuals to connect, especially in the wake of the COVID-19 pandemic where face-to-face communication can become a health risk. This is why business travel remains important for modern companies. If you want to make the most out of your corporate trips, being knowledgeable about the ins and outs of the industry is important. This is where checking business travel statistics becomes necessary.
In this article, we will be discussing everything from the market size of the business travel industry to the use of budgeting software for corporate travel. Furthermore, we have provided some data on emerging business travel technologies. This way, it would be easier to understand how to manage your company trips better as well as prepare yourself for the shifting demands of the industry.

Business Travel Statistics Table of Contents
- General Business Travel Statistics
- Business Travel Spending Statistics
- Statistics on Business Travel Benefits
- Business Travel Experience Statistics
- Bleisure Statistics
- Statistics on the Modern Business Traveler
- Business Travel Policy Statistics
- Statistics on Business Travel Concerns
- Business Travel Tech Usage Statistics
- Impact of COVID-19 on Business Travel
1. General Business Travel Statistics
Corporate trips may have become more and more prevalent over the years, thanks to the increasingly globalized business landscape. So much so that millions of business travel initiatives are launched each year. However, with the current pandemic, business travel has come to a halt and it is not expected to recover until 2027.
- There are 445 million business trips every year. (Certify, n. d.)
- Business travelers make up 12% of an airline’s passengers, but they represent 75% of the profit. (Investopedia, 2020)
- The global market for business travel is projected to decline by 4.5% in 2021. (ReportLinker, 2020)
- It won’t be until 2027 that the global market for business travel is expected to recover, at which point it is expected to reach US$829.5 billion. (ReportLinker, 2020)
- The global market for business travel is expected to post a CAGR of 3% from 2020 to 2027. (ReportLinker, 2020)
Breakdown of Corporate Travel Across the Globe
Companies across the globe understand how important it is to invest in corporate travel. With companies spending an average of $799 per person per day, the business travel market has surely enjoyed the growth in revenue in the past years. Unfortunately, however, when the pandemic hit, many countries experienced huge losses in business travel spending.
- China lost $404 billion in business travel spend losses due to the COVID-19 pandemic, the biggest amount among member countries of the Global Business Travel Association (GBTA). (GBTA, 2020)
- The second most affected region was Europe, which amassed $190.5 billion in business travel spend losses due to the COVID-19 pandemic. The third most affected region was Asia-Pacific, excluding China, Hong Kong, and Taiwan, with losses amounting to $120.2 billion. (GBTA, 2020)
- The most expensive business travel location in Asia is Hong Kong, with an average cost of $515 per day. (ECA International, 2019)
Business Trips in the US
American companies are one of the top spenders when it comes to business travel. Simply put, many US companies spend to send their employees on domestic and international trips for business purposes. However, much like the rest of the globe, they are also expected to decrease the number of international business trips in the coming years.
- In a survey, 45% of respondents said that their company canceled most international business trips to the U.S. as a result of the pandemic. (GBTA Coronavirus Poll/Statista, 2020)
- U.S. airlines reported a 90% reduction in business travel in Q2 2020. (Spendesk, 2019)
- The reduction in travel spending resulted in a loss of $162 billion for the U.S. economy in 2020. (U.S. Travel Association, 2020)

2. Business Travel Spending Statistics
It’s no secret that corporate travel is expensive. As you’ll see in the data below, companies spend millions of dollars per year on sending their employees on business trips. To ensure steady business travel funding, you should plan and create a budget for it ahead of time, taking into consideration not only accommodation and airfare but also looking into vaccination expenses for employees. This way, they may avoid the risk of contracting coronavirus while they’re traveling. Moreover, you should keep all travel costs in check. For this, you might find that using tools for budgeting can be useful for your company.
- Global business travel decreased by more than half in 2020 to $694 billion. (PhocusWire, 2021)
- Corporate travel spending is expected to lose $820 billion as a result of the pandemic. (CNBC, 2020)
- As of September 2020, China’s number of domestic passengers reached Corporate travel spending 98% of 2019 levels. (Skift, 2020)
- The average daily cost of business travel in the US is $325 per day. (Small Biz Genius, 2021)
- Businesses spend roughly $1,425 for every employee they send on a business trip. (Fyle, 2020)
- Companies spend $111.7 billion on business travel every year. This is an average of $1,286 per work trip. (Travel Pulse, 2020)
- Businesses spend $31.6 billion on international travel. This is an average of $2,600 per person. (Certify)
- The average business travel budget consists of money for lodging (34%), airfare (27%), meals (20%), and car rentals (19%). (Travel Pulse, 2020)
Air Travel Expenditures
If your company is affiliated with businesses located halfway across the globe or on the other side of the country, then spending on air travel is inevitable. So, you should prepare a good chunk of your budget for airfares, especially considering flight tickets and miscellaneous spending at airports are increasingly expensive. You might also want to time your booking so you can get tickets at lower rates.
- The average domestic airfare in the US is $392. (Business Insider, 2019)
- The average cost of coach airfare for international flights is $1216. (Certify)
- Domestic flights in the U.S. are 41% lower on average because of the COVID-19 pandemic. (CNBC, 2020)
- Booking flights 169 to 319 days in advance allows you to fly at the time you prefer and get the seats that you want. (CheapAir, 2018)
- The prime booking window is 21 to 121 days in advance of your preferred flight. The fares are the lowest during this time. (CheapAir, 2018)
- The most costly airports based on lunch, taxi, executive lounge, and parking expenses are London Stansted (£608.29), Amsterdam (£567.35), and London Gatwick (£520.53). (FairFX Blog, 2018)
- The airports that give business travelers the most value for their money based on lunch, taxi, executive lounge, and parking expenses are Barcelona (£236.36), Belfast International (£228.28), and Beijing (£170,03). (FairFX Blog, 2018)
- 70% of corporate travelers said that their most important consideration in booking airline tickets after COVID-19 is flexibility in cancellation and changing ticket conditions. This is followed by special measures to ensure onboard hygiene (63%), availability of direct flights (61%), and sanitation levels of aircraft between flights. (Skift Research & McKinsey, 2020)
Road Transportation Costs
More often than not, business travelers still need to go from one place to another upon reaching their destinations. So, it makes sense for them to spend on road transportation. For domestic trips just outside of the city, this might involve gas money for their personal vehicles. In case they have to go farther away, they will need to allocate a budget for car rental. There might also be those who opt to use ride-sharing applications during the trip, although this may not be as popular an option amid the pandemic.
- Three-fourths of business trips are less than 250 miles from the point of their departure. (U.S. Bureau of Transportation Statistics, 2017)
- Personal cars are often utilized for 81% of business trips. (U.S. Bureau of Transportation Statistics, 2017)
- New demand for road trip travel has led car rental rates in the U.S. to decrease by approximately 15% in 2020. (CheapCarRental, 2020)
- 65% of users stopped using ridesharing services in the U.S. due to the COVID-19 outbreak. (Statista, 2020)
Accommodation and Other Expenses
Business travelers require accommodations that are affordable, secure, and trustworthy. What’s more, staying at a place where they have access to conveniences such as workstations and free WiFi can ensure their productivity while on the go. Plus, with the current pandemic, it is also important to consider what hygiene protocols your intended accommodation implements to ensure the safety of your employees. This is why many companies are willing to spend more on hotel rooms and Airbnb accommodations.
- 40% of hotel guests are business travelers. (American Hotel & Lodging Corporation, 2015)
- In 2020, the average hotel room price dropped significantly by 32% to $186 per night compared to $274 per night in 2019. (NerdWallet, 2020)
- Tech companies prefer Airbnb accommodations. In fact, their bookings have doubled from 2017 to 2018. (TravelPerk)
- In 2018, more than 700,000 businesses utilized Airbnb for Work for their corporate trips. (PhocusWire, 2018)
- For the fiscal year 2020, the IRS has set the per-diem business travel rates for meals and incidental expenses at $71. (Maxwell, Locke & Ritter, 2020)
- When it comes to accommodations, business travelers pay attention to quality (44%), trustworthiness (38%), convenience (40%), quietness (30%), affordability (28%), and coziness (28%). (CWT Research, 2019)
How do businesses spend on travel?
A breakdown of the average corporate trip budget.
Car rentals
Source: Travel Pulse
Top Budgeting Software
- Freshbooks. This budgeting and accounting software is popular among businesses of all sizes. Learn more about its features like expense tracking, automatic vendor profile creation, sales tax, project overviews, and many more here in our Freshbooks review .
- Sage 50cloud. As a top accounting and budgeting platform, it sports important features such as billing, invoicing, contact management, budgeting, and even forecasting tools. Read about how users leverage this top platform for their business here in our Sage 50cloud review .
- Quickbooks Enterprise. This comprehensive accounting platform is equipped with inventory management, advanced reporting, and FSM to help you budget for projects, operations, or new investments. Learn more about this product in this Quickbooks Enterprise review .
- Xero. This is a popular accounting app designed for freelancers and small businesses. See how its easy-to-use interface is packed with comprehensive and robust features here in our Xero review .
- FreeAgent. This powerful online budgeting and accounting tool sports tax management, invoice management, expense management, and payment gateway integrations. See why freelancers and small businesses love this platform here in our FreeAgent review .
3. Statistics on Business Travel Benefits
Many companies may think that business travel is passé or that it is a waste of money. However, statistics show that this is most certainly not the case. Corporate trips actually allow businesses to foster stronger and more close-knit relationships with potential clients and partners. Thus, they yield a good ROI for their business travel initiatives and even grow their company at a faster pace. In addition, even amid a pandemic, many professionals cite business travel as a job perk.
- 90.6% of corporate travel managers believe that business travel is crucial to company growth. (Skift + TripActions Business Travel Survey, 2019)
- On the other hand, 91.3% of business travelers said that business travel is crucial to company growth. (Skift + TripActions Business Travel Survey, 2019)
- Companies get a $2.90 increase in profit and a $9.50 increase in revenue for every dollar spent on corporate travel. (Certify)
- 79% of employees say that business travel experience has an impact on their overall job satisfaction. (Global Business Travel Association, 2017)
- 83% of employees say that business travel is a job perk. (Stratos Jet Charters, Inc., 2020)

4. Business Travel Experience Statistics
Corporate travelers are consumers. So, in a similar light as your typical shopper, they expect personalized experiences when it comes to traveling. In fact, they are more than willing to provide their preferences and personal information if it means travel agencies and airline companies will provide them with better products and services. In addition to these, modern business travelers also don’t mind paying extra out of their pocket for upgrades on accommodations and transportation.
- Nine in 10 corporate travelers will share their travel preferences for a customized experience. (CWT Research, 2019)
- 65% of travelers are willing to provide additional personal information to accelerate processing at the airport. (International Air Transport Association, 2018)
- 22% of frequent travelers want travel companies to remember their personal data. (Accenture, 2017)
- 67% of modern travelers expect brands to help them make good travel decisions based on previous travel information. (Accenture, 2017)
- 55% of business travelers are willing to pay out of their own pocket to get upgrades for accommodations, car rentals, and airline seats. (AeroLatinNews, 2018)
Improving the Experience of Corporate Travelers
Business travel may not be as prevalent now. But this pause makes it the perfect time to ask, how can you improve the overall business travel experience? Now that we know corporate travel anchors on personalization and convenience, it is important to utilize the available technologies to enhance the travel management process.
Moreover, travel managers should actively measure the satisfaction of business travelers to determine any other points for improvement. To do this, you might want to consider utilizing best-in-class business intelligence platforms or top-rated data analytics software .
- Travelers say that their experience can be improved using real-time and accurate travel notifications (55%) and automatic flight rebooking (53%). (International Air Transport Association, 2019)
- A business travel report revealed that 79% of business travel managers say that partnering with travel management companies can lead to more efficient processes and higher savings. (Egencia, 2018)
- 80% of corporate travel managers say that having a system of measurement can benefit corporate travel initiatives. (ACTE, 2018)
- 98% of corporate travel managers say that the most important metrics to measure are traveler satisfaction, policy compliance, and savings and expenditures. These are followed by booking statistics (96%) and traveler engagement (90%). (ACTE, 2018)
Points for Improvement for Airlines, According to Passengers
5. bleisure statistics.
“Work hard, play hard” is the mantra of modern businessmen and corporate employees. So, before 2020, it was not surprising that employees have made it a point to extend their trip for leisure or, at the very least, allocate time for fun activities during a trip. While this may not be a possibility with the ongoing pandemic, it is certainly a trend that companies should anticipate as travel restrictions and quarantine protocols relax. After all, it will allow your company to reinforce work-life balance for employees.
One thing to note about bleisure, however, is that this may also pose problems for companies when it comes to accountability and productivity. After all, administrators don’t know how their business travelers will spend their time during a trip. In case you feel like this might be an issue for you, you can always opt to use time tracking software solutions. Using these, business travelers may log their productive hours even while away from the office.
- Bleisure trips have increased by 20% between 2016 and 2017. (Forbes, 2018)
- Business travelers enjoy exploring new places and cultures (41%) more than meeting with clients and teams (17%). (Medium, 2017)
- 80% of corporate travelers make sure to squeeze in fun activities while on a business trip. (National Car Rental, 2018)
- Almost half of the corporate trips (40%) are extended for leisure. (Expedia Group, 2016)
Employee Expectations on Bleisure
Nowadays, business travelers are not shy about taking some time off while on a trip. After all, they deserve to have a bit of fun after working long hours out of the office. This is why they expect companies to cover bleisure in their travel policies.
- 82% of travelers expect support from their superiors when taking a break on business trips. (National Car Rental, 2018)
- Employees want their companies to consider bleisure for their travel policy. This means including a budget for extracurriculars (74%) and giving them the option to bring a guest on the trip (38%). Moreover, they want to be provided with the flexibility to extend their trips for leisure (34%) and given a budget for exercise and similar lifestyle activities during the trip (24%). (National Car Rental, 2018)
- 37% said that leisure activities should have an equal length as business activities during a corporate trip. (Expedia Group Media Solutions, 2016)

6. Statistics on the Modern Business Traveler
So, who is the modern corporate traveler? Statistics show that these travelers are mostly college-educated males who are older than 45 years old. They go on trips to attend conferences, build business partnerships, develop their careers, and find investors. Moreover, a handful of them spends a good fraction of their year traveling for business purposes.
- Two-thirds of corporate travelers have a bachelor’s degree. Moreover, they have an average household income of $82,000. (PhocusWire, 2017)
- 60% of business travelers are male. Meanwhile, 50% are older than 45 years old. (PhocusWire, 2017)
- Employees go on business trips to attend conferences (62%), to meet with other companies for business planning (56%), for professional development (44%), to meet with coworkers in a different location (40%), and to pitch new products (30%). (Skift, 2016)
- The top 10% of business travelers spend an average of 88 nights away from their homes per year. (Corporate Traveler, 2017)
- 50% of business travelers from Europe go on trips alone. (Fly Aeolus, 2017)
The Millennial Business Traveler
Millennials are poised to comprise the majority of the workforce in the coming years. So, it only makes sense that we tackle how millennial employees view business travel and how they travel for business.
In the statistics we’ve culled, millennials see being sent on corporate trips as a job perk than an inconvenience. So much so that they even create reasons to travel for business. In fact, as of 2016, this generation has become the most active business travelers.
Another thing that sets them apart from previous generations is that while they prioritize cost-efficiency by avoiding expensive hotels and flights, they have a penchant for bleisure. This means they make it a point to balance each trip for both business and leisure.
- 65% of business travelers who are millennials view corporate trips as a status symbol. (Forbes, 2018)
- 56% of millennials create reasons to go on business trips. Moreover, 69% of them want to extend their trip for leisure. (Forbes, 2018)
- Millennials go on 7.4 trips every year. (Skift, 2016)
- Millennial business travelers in the tech industry prioritize cost-efficiency by opting for non-chain hotels. Also, 85% of them booked budget flights instead of choosing business class seats. (TravelPerk)
- 78% of Millennials intentionally make time for leisure on business trips. (Business Wire, 2016)
Why Do Employees Go On Business Trips?
To attend conferences
To meet with other companies for business planning
For professional development
To meet with coworkers in a different location
To pitch new products
Source: Skift
7. Business Travel Policy Statistics
Business travelers represent your company. So, how they travel must be in line with your business values. This is why it is pertinent to have a corporate travel policy.
With this, you can set standards as to where they should stay, which airlines to pick, what car rentals to choose. It also allows you to set rules around what gifts may be purchased during the trip. In addition, travel policies can serve as a guideline for on-site spending.
However, not every company and business traveler realizes the value of a travel policy. So, many opt not to create one.
If you don’t have one, you might want to find a good travel management software to do it. As an alternative, you may also utilize reliable business process management solutions .
- A business travel market report revealed that 40% of businesses still don’t have a travel policy. (Egencia, 2018)
- 60% of corporate travelers say they don’t understand the need for a company travel policy. (TravelPerk, 2019)
- Companies allow more than half of business travelers to book their trips however they prefer. (Egencia, 2018)
- The factors that have a negative impact on business travel are the lack of formal processes and outdated booking systems. (Medium, 2017)
Corporate Travel Management Problems
Of course, simply having a travel policy is not a surefire way to maximize corporate trips. Its positive effect on your business travel processes depends on how you implement it. As you’ll see in the business travel statistics below, companies with travel policies encounter their fair share of problems.
Many of them have travel policies that are not in line with their company culture. Furthermore, not all of them can manage their policies effectively. Lastly, they have many employees who choose not to comply with the policy they have in place.
- 27% of business travelers say that their company’s travel policy is ill-managed. (Medium, 2017)
- 52% of employees say that their company’s travel policy only moderately aligns with their company culture. (Medium, 2017)
- 69% of business travelers comply with corporate travel policies. (Lola.com, 2019)
- Business travelers often book accommodations out-of-policy because they are not close enough to the destination (37%) or because they found a better hotel within their per diem (37%). (Egencia, 2018)

8. Statistics on Business Travel Concerns
While there may be quite a lot of tools that you can use to optimize the business travel experience, the industry still has a long way to go. What’s more, with the pandemic, corporate travelers today are poised to encounter more obstacles and concerns that may impede them from being the most efficient they can be. For example, many of them still need to deal with delayed flights, long waiting times at the airport, as well as the hassle of lengthy security and safety processes.
- The most common issues that business travelers face are flight delays (65.7%), flight cancellations (31.9%), and paying for travel expenses with a personal credit card (30.5%). These were followed by their company’s tool not having the best booking rates (29.3%) and lack of support in resolving issues while traveling (23%). (Skift + TripActions Business Travel Survey, 2020)
- The most tiring aspects of business travel are the waiting time (27%) and having no direct flights (25%). In addition, travelers feel that the ride to and from the airport (22%), early or late departures/arrivals (16%), and the flight itself (10%) are also exhausting. (Fly Aeolous, 2017)
- The longest waiting times for security screening at US Airports in 2019 are Newark Liberty International, NJ (23.1 minutes), George Bush International, TX (19.8 minutes), Miami International, FL (19.6 minutes), and Baltimore-Washington International (18.2 minutes). (Statista, 2019)
Source: Statista
9. Business Travel Tech Usage Statistics
Corporate travelers are a tech-savvy bunch. They rely heavily on the internet and their smartphones to manage their trips. Moreover, they have quite a knack for learning new technology. As a result, they have high expectations for their companies, travel agencies, airline companies, and similar firms when it comes to innovation.
For example, they want to have access to all-in-one applications that will help them consolidate and accelerate the travel planning process. In addition, they are looking forward to having voice-activated assistants for travel queries. As you’ll see below, these are only a few of the many things that they are expecting from the industry.
- 51% of passengers around the world used a smartphone or other device to check in online. (IATA, 2019)
- 27% of global passengers use an airline app to make last-minute purchases such as an additional bag, upgrade, or lounge access. (IATA, 2019)
- The majority of modern travelers (57%) want to have a single application to manage their planning and booking needs. (Booking.com, 2018)
- 57% of travelers want to have a mobile app that will let them track their luggage in real-time. (Booking.com, 2018)
- 31% of travelers say they like the idea of using voice-activated assistants for their travel queries. (Booking.com, 2018)
FinTech Options for Business Travel
Traveling involves quite a lot of expenditures. Therefore, corporate travelers make a large number of transactions that need to be accounted for after each trip. However, manually tracking spending during a trip can be tedious and prone to errors.
As a result, many travelers are now relying on financial technology, such as expense management software and cashless transactions. These allow them to record their expenditures as they go and make sure that they remain within budget. With these, it is easier for companies to maximize their travel budget down to the last penny.
- It takes an average of 40 hours per month for business travelers to reconcile their expenses and payment data. (Egencia, 2018)
- 66.5% of companies use an online expense reporting platform with a mobile solution. (Business Travel News, 2020)
- In light of the pandemic, 55.7% of corporate travel managers say that contactless payments have become a higher priority for their travel program. (Business Travel News, 2020)
- 51% of corporate travelers believe that all business trip payments will be made via mobile devices in a few years. (Business Travel News Europe, 2017)
The Decline of Ride-Hailing Apps
Ride-sharing apps are undoubtedly cheaper and more convenient alternatives than car rental and chauffeur services. However, with the current pandemic, it seems less and less business travelers are willing to leverage them due to the risk of contracting the virus.
- Ride-hailing companies make up 70.5% of all ground transportation receipts for business trips. (USA Today, 2018)
- Usage of ride-sharing apps like Uber and Lyft dropped between 70% to 80% due to travel reductions brought about by the pandemic. (Forbes, 2020)
- 39% of U.S. consumers who previously used ride-sharing plan to lessen their use of these services. (CarGurus, 2020)
- However, the total number of ride-sharing services are expected to reach 71.3 million users in 2021. (eMarketer, 2020)
Augmented Reality and Virtual Reality Tech
Business travelers, while often trained to deal with unforeseen circumstances, want to come prepared. That is to say; they like visualizing how their travel plans are going to pan out well before the actual trip. To do this, they must familiarize themselves with their destination.
This is where augmented reality (AR) and virtual reality (VR) comes in. These technologies will allow them to get the lay of the land. So, it is easier to map out their itineraries and manage expectations for the trip. For more information about this tech, be sure to check out our list of VR statistics for 2019 .
- Business travel data reveals that 1 in 5 travelers want to use AR so that it is easy to check out their destination before a trip. (Booking.com, 2018)
- 81% of business travelers expect hotels to use virtual, reception-free check-in processes in the future. Meanwhile, 79% predict that using VR tech for accommodations will become the norm in the next 10 years. (Business Travel News Europe, 2017)
Artificial Intelligence
In a similar vein as practically every other industry, business travel is also being reshaped by artificial intelligence (AI). Many travel companies, managers, and corporate travelers rely on this tech to make their trips much more efficient. As you’ll see below, they find this very useful when it comes to monitoring employees as well as finding travel suggestions for planning.
- The majority of corporate travel managers (82%) say that the use of AI for business travel is “very useful” or somewhat useful.” (Skift, 2018)
- 55% of business travelers say they will allow employers to use GPS tracking to monitor their location during out-of-town trips. (Travelport, 2018)
- 41% expect travel brands to use AI to provide them with significant travel suggestions. (Booking.com, 2018)

If you are looking for emerging trends in AI usage, we also have this list of AI statistics that you might find handy.
10. Impact of COVID-19 on Business Travel
With lockdowns and travel restrictions, COVID-19 has turned the business travel sector upside-down. Even as vaccination programs offer a glimmer of hope that business will resume soon, companies still worry about their liabilities for employees who travel without getting vaccinated.
- At the outset of the pandemic, 98% of member countries of the Global Business Travel Association canceled international business tours, while 92% canceled all or most of their business trips. (GlobeNewswire, 2020)
- International business travel experienced a sharp decline of -70% in 2020. (U.S. Travel Association, 2021)
- In a survey, 24% of respondents said that their company is considering returning to domestic travel in one to three months. (Global Business Travel Association, 2020)
- On the other hand, only 6% of respondents said that their company is considering returning to international business travel in one to three months. (Global Business Travel Association, 2020)
- 57% of business travelers are considering taking a trip in the next six months. However, corporate travel and meeting planners are concerned with their liability if employees travel without being vaccinated. (MMGY Global, 2020)
- Only 6% of people miss traveling for business, compared to 48% who miss travel to spend time with loved ones. (Airbnb, 2021)
- Moreover, as of December 2020, 21% of travel managers report that they are not willing to travel for work. (Global Business Travel Association, 2020)
- When the pandemic is over, 36% of people expect to travel less for work compared to pre-COVID conditions. (Airbnb, 2021)
Source: GBTA 2020
What Do These Business Travel Facts Mean for Your Company?
The pandemic has changed not only the number of flights worldwide but also the entire face of business travel. But with some signs of bouncing back in the years to come, it is hoped that things will soon be better for one of the industries that were deeply hit by the pandemic. Until then, it is important for companies to find ways on how to carry out business travel in these challenging times.
After all, while it may be convenient to connect with people using video conferencing and similar modes of communication, we have to admit that these are not enough. Getting your message across to customers, colleagues, and potential partners is only half the purpose of these business interactions. If you truly want to build rapport, develop trust, and ensure coordination. Undoubtedly, face-to-face meetings are still the way to go. This is why business travel remains a crucial part of many industries.
As you have already read in our article, corporate travel is expensive, and it is getting more so every year. However, when these are planned thoroughly and executed properly, you can open more opportunities for your company. It can even help you attract the best talents for your company.
Just be sure to take the time to understand the needs of your business travelers. This way, you can have a better idea of how you can improve the experience for them and maximize their participation in each trip.
To sum up, we hope that our list of business travel statistics was able to help you get a better idea of the state of the industry as well as where it is headed. With this data, preparing for future business travel efforts should be much simpler.
Key Insights
- Pandemic Impact : Business travel experienced a significant decline due to COVID-19, with global market recovery not expected until 2027.
- Spending Statistics : Corporate travel spending is costly, with companies averaging $1,425 per employee per trip and $111.7 billion annually on business travel.
- Travel Benefits : Business travel is seen as crucial for company growth, with a positive ROI and a significant impact on employee job satisfaction.
- Bleisure Trend : A notable portion of business trips are extended for leisure, with 80% of travelers incorporating fun activities during their trips.
- Traveler Demographics : Modern business travelers are typically well-educated, middle-aged males with higher household incomes, traveling for conferences, business planning, and professional development.
- Travel Concerns : Common issues include flight delays, long waiting times, and managing travel expenses, especially amid pandemic-related travel restrictions.
- Tech Usage : Business travelers rely heavily on technology, preferring mobile apps for planning and booking, and expecting innovations like AI and AR to enhance their travel experiences.
- How has COVID-19 affected business travel? The COVID-19 pandemic drastically reduced business travel, with a 70% decline in international business trips and a significant reduction in domestic travel. The global market is not expected to recover until 2027.
- What is the average cost of a business trip per employee? On average, companies spend $1,425 per employee for each business trip. This includes expenses for lodging, airfare, meals, and car rentals.
- Why is business travel considered important for companies? Business travel is crucial for fostering strong relationships with clients and partners, yielding a positive return on investment, and contributing to company growth. It also impacts employee job satisfaction and is seen as a job perk by many.
- What is the “bleisure” trend in business travel? “Bleisure” refers to combining business and leisure during a trip. Many business travelers extend their trips for leisure activities, with 80% incorporating fun activities and 40% extending trips for leisure purposes.
- Who are the typical modern business travelers? Modern business travelers are generally college-educated males over 45 years old, with an average household income of $82,000. They travel for conferences, business planning, professional development, and to meet with colleagues or pitch new products.
- What are the main concerns of business travelers? The primary concerns include flight delays, long waiting times, flight cancellations, and the hassle of managing travel expenses. The pandemic has added concerns about health and safety during travel.
- How do business travelers use technology? Business travelers heavily rely on technology, using mobile apps for planning and booking, and expecting innovations like AI, AR, and real-time notifications to enhance their travel experience. They also use expense management software for tracking expenditures.
- What impact did the pandemic have on corporate travel spending? The pandemic caused a significant decline in corporate travel spending, with a loss of $820 billion globally. U.S. airlines reported a 90% reduction in business travel in Q2 2020, resulting in a loss of $162 billion for the U.S. economy.
- How do companies manage business travel expenses? Companies often use budgeting and accounting software to manage business travel expenses. This includes tools for tracking lodging, airfare, meals, car rentals, and incidental expenses to ensure cost-efficiency.
- What are the future expectations for business travel? While the industry is expected to recover gradually, business travel will likely be reshaped by new technologies and increased health and safety measures. Companies and travelers will prioritize flexibility, hygiene, and cost-efficiency in their future travel plans.
References:
- 10 fun facts for business travel road warriors. (2017, July 31). Corporate Traveller .
- 2018 airfare study – The best time to buy flights, based on 917 million airfares. (2018, March 21). CheapAir .
- 91 business travel statistics (Some never before released). (2019, June 6). TravelPerk .
- ACTE Research. (2020, January 28). Quality management in business travel. BCD Travel .
- Advances in procurement technology and business travel. (2018, November 19). Egencia .
- Baker, M. (2019, April 18). 5 reasons your corporate travel policy needs regular review. Lola.com .
- Booking.com reveals 8 travel predictions for 2019. (2018, October 18). Booking.com .
- Business travellers expect to be cashless by 2027. (2017, September 28). BTN Europe .
- CarGurus U.S. COVID-19 sentiment study. (2020, April). CarGurus Dealer Resource Center .
- Coronavirus poll results. (2020, December 17). Global Business Travel Association – GBTA .
- Cramer-Flood, E. (2020, September 22). Uber and Lyft users and sales will decline dramatically this year. Insider Intelligence – eMarketer .
- CWT research: Two-thirds of travelers pick window over aisle; 52% prefer missed flight over lost luggage. (2019, April 30). CWT .
- CWT™ Research. (2019, June 26). RoomIt by CWT™ research reveals key differences in business traveler hotel preferences by country. CWT .
- Deane, S. (2020, May 15). Over 60 business travel statistics (2021). Stratos Jet Charters, Inc .
- Ferreira, M. (2018, December 12). The most expensive airports for business travellers. FairFX Blog .
- Getting back to business: Navigating the safe return of meetings and their role in economic recovery. (2020). U.S. Travel Association .
- Ghijs, S. (2017). The business flight travel survey statistics. Fly Aeolus .
- Global business travel industry. (2021, April). Reportlinker.com .
- Goldstein, M. (2018, June 28). Millennials say business travel is rough, give us more. Forbes .
- Goldstein, M. (2020, July 27). What is the future for Uber and Lyft after the pandemic? Forbes .
- How innovative companies travel. (2017). TravelPerk .
- IATA global passenger survey 2018 highlights. (2018). IATA .
- IATA global passenger survey 2019 highlights. (2019). IATA .
- Infographic – The average cost of business travel. (n.d.). Certify .
- Jet, J. (2018, October 25). Are Bleisure trips becoming more common? This study says yes. Forbes .
- Jovic, D. (2021, January 11). 42 business travel statistics you should know about in 2021. SmallBizGenius .
- Kaki, M. R. (2020, March 25). A comprehensive guide to building corporate travel policy. Fyle .
- Kemmis, S. (2020, August 24). Analysis: How have hotel prices changed in 2020 vs. 2019? NerdWallet .
- Lodging industry trends 2015. (2015). American Hotel & Lodging Association – AHLA .
- London ranked joint 10th most expensive location in the world for business trips. (2019, April 17). ECA International .
- May, K. (2021, February 2). Business travel expected to make full recovery by 2025. PhocusWire .
- Mazareanu, E. (2020, November 6). Topic: Ridesharing services in the U.S. Statista .
- McCarthy, N. (2019, August 19). Infographic: TSA security: The longest waits at U.S. airports. Statista Infographics .
- McDonald, M. (2017, July 19). New GBTA report highlights huge impact of business travel on the US economy. PhocusWire .
- Menze, J. (2018, August 6). Airbnb for work bookings triple, drive “significant” growth for homes business. PhocusWire .
- Mezi. (2017, July 13). The changing landscape of business travel. Medium .
- More than 40 percent of business trips are extended for leisure purposes. (2016, December 7). Expedia Group Media Solutions .
- The most expensive US destinations to rent a car 2020. (2020, August 6). Cheap Car Rental . https://www.cheapcarrental.net/press/summer2020.html
- National car rental 2018 state of business travel survey fact sheet. (2018). National Car Rental .
- New GBTA research shows coronavirus continues to impact the business travel industry. (2020, March 10). Global Business Travel Association – GBTA .
- Perrotta, A. (2020, November 5). Technology trend watch. Business Travel News .
- Pitrelli, M. B. (2020, September 23). Many thought airfares would spike in the age of coronavirus. That’s not happening yet. CNBC .
- Qui, S., & Freed, J. (2020, October 15). China’s domestic flights in September top pre-pandemic levels. Skift .
- Reid, C. (2020, December 16). Travel in 2021 will be better and worse than you think. MMGY Global .
- Report: 2021 will be the year of meaningful travel. (2021, January 28). Airbnb .
- ReportLinker. (2020, November 19). Global business travel industry. GlobeNewswire News Room .
- Reuters. (2020, March 11). Business travel sector to lose $820 billion in revenue on coronavirus hit, industry group says. CNBC .
- Sanchez, M. (2017, October 11). Business travel’s influence on employee retention, recruitment and results. Global Business Travel Association – GBTA .
- Sheivachman, A. (2016, October 27). Millennials are now the most frequent business travelers. Skift .
- Skift Research, & McKinsey & Company. (2020, September). The travel industry turned upside down. McKinsey & Company .
- Skift, & Turkish Airlines. (2018). The 2018 Skift global business traveler report. Skift .
- Small business owners realize benefits in taking vacations, but still struggle to unplug, Marriott rewards premier business credit card survey reveals. (2016, June 14). Business Wire .
- Statista Research Department. (2021, February 18). COVID-19 impact on business trips to U.S. 2021. Statista .
- Travelport survey shows business travelers most willing to allow employer tracking. (2018). Travelport .
- Travelport: Over half of business travelers willing to pay for extras. (2018, August 15). AeroLatinNews .
- Trejos, N. (2018, May 2). These are the most expensed restaurants, hotels, airlines among business travelers. USA TODAY .
- TripActions, & Skift. (2019, October 24). New report: The state of business travel 2020. Skift .
- TripActions, & Skift. (2019, October 28). New report: The state of business travel 2020. Skift .
- U.S. business travel. (2017, May 20). Bureau of Transportation Statistics .
- Updated business travel IRS per diem rates have been announced for 2020. (2020, September 30). Maxwell, Locke & Ritter – MLR .
- Weekly coronavirus impact on travel expenditures in the U.S. (2021, January 22). U.S. Travel Association .
- Weir, M. (2019, November 5). How much airfare in the US costs today compared to 10 years ago. Business Insider .
- Whatman, P. (2021, March 30). 60+ fascinating business travel statistics for 2021. Spendesk .
- Which passengers make the most money for airlines? (2020, October 7). Investopedia .
- Wood, D. (2020, February 25). REPORT: Companies spend $111.7 billion annually on business travel. TravelPulse .
- YOUNIQUE: Personalized marketing index, the new travel experience. (2017). Accenture .

By James Anthony
A senior FinancesOnline writer on SaaS and B2B topics, James Anthony passion is keeping abreast of the industry’s cutting-edge practices (other than writing personal blog posts on why Firefly needs to be renewed). He has written extensively on these two subjects, being a firm believer in SaaS to PaaS migration and how this inevitable transition would impact economies of scale. With reviews and analyses spanning a breadth of topics from software to learning models, James is one of FinancesOnline’s most creative resources on and off the office.
Related posts

36 Critical Call Center Software Statistics: 2024 Data Analysis & Market Share

Best Website Builder Software in 2024

How to do payment gateway integration in PHP, Java and C# in 2024

10 Best Open Source Applicant Tracking Systems (ATS) for 2024

What Are the Most Important Skills of A Project Manager in 2024 and Why?

20 Best File Sharing Software Solutions of 2024

20 Best Computer Monitoring Software in 2024

Toast vs. Clover: 2024 Comparison of Features, Pricing & Integrations & More

What is the Purpose of CRM Software In a Business in 2024?

15 Leading Property Management Software Examples in 2024

15 Best Online Accounting Software in 2024

20 Best HR Software Solutions of 2024

20 Best Purchase Order Software in 2024

15 Best Employee Scheduling Software of 2024: Comparison of Leading Solutions

What Is Backup Software? Analysis of Features, Benefits and Pricing

15 Best VPN Extensions for Mozilla Firefox in 2024

Pros and Cons of ShipBob: Analysis of a Top Ecommerce Software

Top 10 Alternatives To Jobber: Leading Field Management Service Software Solutions

360Learning Pricing Packages: What’s Included in the Plans?

List of Help Desk Software Companies of 2024
Leave a comment!
Add your comment below.
Be nice. Keep it clean. Stay on topic. No spam.
Why is FinancesOnline free?
FinancesOnline is available for free for all business professionals interested in an efficient way to find top-notch SaaS solutions. We are able to keep our service free of charge thanks to cooperation with some of the vendors, who are willing to pay us for traffic and sales opportunities provided by our website. Please note, that FinancesOnline lists all vendors, we’re not limited only to the ones that pay us, and all software providers have an equal opportunity to get featured in our rankings and comparisons, win awards, gather user reviews, all in our effort to give you reliable advice that will enable you to make well-informed purchase decisions.
EU Office: Grojecka 70/13 Warsaw, 02-359 Poland
US Office: 120 St James Ave Floor 6, Boston, MA 02116
- Add Your Product
- Research Team
- Terms of Use
- Privacy Policy
- Cookies Policy
- Scoring Methodology
- Do not sell my personal information
- Write For Us
- For Small Business
- Top Software
- Software reviews
- Software comparisons
- Software alternatives
Copyright © 2024 FinancesOnline. All B2B Directory Rights Reserved.

How Much Should a Business Trip Cost?

How Do You Calculate Travel Costs?
So how do these average costs break down into specific expenses? Planning a business trip usually involves four primary costs:
- Ground transport
- Daily allowance for food and incidental expenses like parking fees
The best way to predict an accurate travel budget is to set clear parameters, and then use an algorithm that can take real-time market rates into consideration along with those parameters. TravelBank starts with default settings like nonstop economy flights, for example, or hotels with 3-star ratings or higher that can easily be customized for each company within the app. A startup with a lean budget and employees willing to weather a little discomfort for the team might opt for a cheaper flight with a layover. A business planning a trip for top executives might prefer business class seats or a top-notch hotel. The U.S. General Services Administration (GSA) per diem standard is a good gauge for daily allowance, or you might reward frequent travelers with a higher allowance as a perk.
In other words, get specific about what plans are right for a typical trip within your business. Companies at different stages of their travel program will have different requirements. When you know what’s right for you, use current market rates to get the most accurate cost estimates.
Business Travel Mistakes to Avoid
If you’re concerned about overspend or want some extra ideas to lower trip spending, watch out for these common issues that can push you over budget.
Put (Less) Money Where Your Mouth Is
Quick, what’s the biggest expense companies pay on business trips? Are you surprised to hear it’s meals? More than 20% of a typical business travel budget goes to food expenses—more than flights, hotels, or car rentals.
Lowering your per diem, or tweaking it for higher-cost vs. lower-cost destinations, might help. So can updating your travel policy to be clear about when it makes sense to entertain clients or business associates, when employees can purchase alcohol, and similar points. You might also want to keep an eye on grocery bills when employees stay at an apartment-style accommodation, and distinguish between per diem meal costs and personal grocery expenses.
Forgetting Airfare Tax
One trap it’s easy for travelers (and business travel managers) to fall into is checking a travel aggregator website for flight deals and forgetting to factor taxes into the cost. Sales tax and various fees can add up to more than 25 percent of the fare! If you’ve already set your budget based on the face value of the ticket, you can quickly end up overspending.
Overlooking Hotel Expense
Airfare can feel like the biggest line item to focus on to reduce trip spending. While the plane ticket often costs more than a single night in a hotel, hotel rates can multiply into an even higher expense. The daily hotel average in the top 100 U.S. cities is $148.83, and hotels make up an average of 13% of travel budgets (compared to 17% for flights).
An easy way to get travelers on board with lowering hotel expenses is to reward them for coming in under budget. A travel rewards program provides great incentive for employees to take extra measures to find cost-effective options.
Also, don’t forget to watch out for daily resort fees and hotel taxes, that like airfare, can accidentally send your traveler over budget—especially if the hotel nightly rate was paid up front and the resort fee is charged upon checkout.

Should You Set a Hard Cap or Dynamic Budget?
There are two basic approaches to setting a business trip budget. Here are the pros and cons of both.
A hard cap budget model sets one limit across the board for your business travel. You’ve got one number to remember, and a black-and-white approach to monitoring compliance. Did the trip cost less than the hard cap? You’re good to go. Over the limit? Supervisors or accounting might need to take a look at traveler compliance.
The benefit of a hard cap is its simplicity. Companies booking only a few very similar trips per year might be able to run with this system fairly well.
The downside of hard cap budgets is that they don’t offer much nuance or flexibility. You’re going to hit administrative issues if employees travel during the destination’s high season, or over a holiday. Hard cap budgets aren’t a “set it and forget it” method, either. You’ll need to review and revise the budget at least every 12 months to keep up with market fluctuations, and probably more often.
Dynamic Budgeting
Dynamic budgets work with real-time data to adjust price expectations to the market rates, travel dates, and destination city. Managers compare data on the average costs of similar trips to the travel plans the employee requests to book.
Dynamic budgeting is a little more complicated on the surface, but it’s a much more realistic way to budget. With a hard cap, your best bet is usually to set the cap based on your most expensive travel destination so you don’t blow your budget. You sacrifice a lot of insight and accountability when it comes to how much travelers spend on cheaper trips. With dynamic budgeting, you have a realistic profile for expenses on every kind of trip your employees take.
A dynamic model is also easier to develop over time, because you’re used to working with real-time data. You’re shaping travel policies and budget expectations around the real world of travel, instead of squeezing trips into the mold of the spend max you set. The result is often more accountability and more appropriate budget guidelines for a wider range of destinations.
Want to beat your budget this year? Learn more about how to set travel benchmarks that fit your business.
About TravelBank
TravelBank delights the back office by getting the books closed faster and providing peace of mind that their employees are complying with policies and budgets, and the traveler by delivering a simple, modern booking and expense tool that takes the business out of business travel.
Your California Privacy Choices
We use technologies, such as cookies, that gather information on our website. That information is used for a variety of purposes, such as to understand how visitors interact with our websites, or to serve advertisements on our websites or on other websites. The use of technologies, such as cookies, constitutes a ‘share’ or ‘sale’ of personal information under the California Privacy Rights Act. You can stop the use of certain third-party tracking technologies that are not considered our service providers by clicking on “Opt-Out” below or by broadcasting the global privacy control signal.
Note that due to technological limitations, if you visit our website from a different computer or device, or clear cookies on your browser that store your preferences, you will need to return to this screen to opt-out and/or rebroadcast the signal. You can find a description of the types of tracking technologies, and your options with respect to those technologies, by clicking “Learn more” below.
You have successfully opted-out.
Before you go, be sure you know:
This link takes you to an external website or app, which may have different privacy and security policies than TravelBank. We don't own or control the products, services or content found there.

What are you looking for?
100+ business travel statistics (2023).
Business travelers contribute a lot to the travel industry in general.
In the US alone, 1.3 million people go on business trips every day.
Although the industry was forced to a slowdown due to the recent Covid-19 pandemic , the business travel market is expected to grow by 188% in 2028.
Today, I’ve summarized everything from the average business travel spending to employee behaviour towards corporate travel.
Whether you’re going on a trip for work or something else, we hope you might find these statistics useful!
Let’s get started…
Sources : You can see the source of every statistics or go to the bottom of this post for a full list of all the surveys and articles used here.
Travellerspoint
What is considered business travel?
Business travel includes any domestic or international trip taken by employees in order to complete corporate-related events. For example, meetings, client works, trade shows, conferences, and product launches.
Business travel spending generally comprises all aspects of the trip, from accommodation and transportation to entertainment.
How many people in the US travel for business?
In the US alone , 1.3 million people travel for business daily.
How big is the business travel market?
The global business travel market was worth $700 billion in 2020.
What percentage of travel is business vs leisure?
In 2021, business travel accounted for 20% of the total global travel and tourism expenditure.
Is the business travel industry growing?
Yes, the business travel market is predicted to grow by 188% in 2028.
Business Travel Key Statistics
- 92% of these countries also called off all or most of their domestic business tours in April 2020.
- The global business travel market was worth $700 billion in 2020.
- By 2028, the business travel market is predicted to grow by 188%.
- Due to the Covid-19 pandemic, the loss in global business travel spending reached over $700 billion in 2020.
- Accommodation makes up 34% of the average business trip cost, while airfare makes up 27%, meals 20% and car rental 19%.
- The average business traveler is male (63%) and aged between 35 and 54 year old (50%).
- In 2021, the United States and Canada both ranked as the best-rated destinations for business and non-leisure travellers.
- 56% of business travelers state that lowering their carbon footprint is a moderate priority, whereas 21% believe that it’s a top priority.
- The share of companies canceling most or all domestic business trips worldwide reached 38% as of October 2021.
- 35.2% of travels buyers believe that travel digitization will increase after the COVID-19 pandemic.
General business tourism statistics
1. although business travelers only comprise 12% of all airline passengers, they contribute up to 75% of profits..
[Investopedia]
This is because corporate travelers tend to pay a higher rate for last-minute and non-stop options.
2. In April 2020, 98% of the member countries of the Global Business Travel Association had to cancel overseas business trips.
[ReportLinker]
3. 92% of these countries also called off all or most of their domestic business tours.
4. nearly all business travel bookings are made online, with 28% of hotel bookings made from the hotel’s website, 14% through a travel agent, 10% from an online travel agency (ota), and 7% through a third-party..
[StratosJets]
Around the world, 57% of all travel bookings are made online .
5. In the US alone, 1.3 million people travel for business daily.
Global business travel market, 6. the global business travel market was worth $700 billion in 2020. , 7. in 2028, the business travel market is predicted to grow by 188%., 8. the global business travel market is estimated to reach $829.5 billion by 2027 at a cagr of 3% over seven years..
The travel market is one of the hardest hit industries in the world by the Coronavirus pandemic. It has begun to recover, albeit slowly, and is expected to reach pre-pandemic levels in roughly seven years.
9. Food & lodging takes up the largest segment in business travel, projected to grow at a 3.7% CAGR and hit $446.6 billion by the end of 2027.
10. the business travel market in the united states was estimated to be worth approximately $243.2 billion in 2020., 11. the chinese business travel market is predicted to grow at a 5.1% cagr until it reaches $49.8 billion in 2027..
China has the second largest economy in the world. It’s forecast to achieve a market size of$49.8 billion by 2027.
12. Japan and Canada’s business travel market are predicted to grow at a rate of 2.2% and 3.1% respectively between 2020 and 2027.
13. meanwhile, germany will grow with a cagr of 2.4% over the same period of 2020-2027. , 14. the asia-pacific region is calculated to reach $114.9 billion market share by 2027, with the notable economies being australia, india, and south korea., 15. in the transportation segment of business travel, us, canada, japan, china and europe is expected to drive the 1.4% cagr, reaching a combined $101.9 billion by 2027., 16. the latin american transportation market of business travel will grow at a 1.8% cagr., business travel spending.
How much are the average business travel expenses?
17. In 2021, business travel accounted for 20% of the total global travel and tourism expenditure, a 1% decrease from 2019.

18. Business travel expenditure peaked at approximately $1.4 trillion in 2019.
Overall, business travel includes work-related trips such as attending meetings, trade fairs, and congresses.
19. Business travel spending is forecasted to reach $0.9 trillion in 2022, and recover to the all-time high of $1.4 trillion by mid-2026.

20. Due to the Covid-19 pandemic, the loss in global business travel spending reached over $700 billion in 2020.
21. global business travel spending is expected to gain 33.8% in 2022., 22. china recorded the world's highest business travel spending in 2021, at almost $295 billion..
The country spending the second highest amount in business travel was United States, at just over half of China’s spending.
23. However, China was also the country that experienced the biggest loss in business travel expenditure ($404 billion) due to the pandemic.
24. europe was the second most impacted region, losing $190.5 billion collectively..
Europe experienced a $190.5 billion loss in business travel during the pandemic.
25. The Asia-Pacific region (not counting China, Hong Kong, and Taiwan) lost $120.2 billion in business travel spending.
26. in terms of business travel spending recovery, north american performed best in 2021, all thanks to the rapid regaining of domestic travel. it’s expected to experience a compounded annual growth of 23.4% by 2026., 27. for 2022, there was an increase of 16.5% ($407.1 billion) in the asia pacific region, recovering to 66% of pre-pandemic levels by the end of the year., 28. accommodation makes up 34% of the average business trip cost, while airfare makes up 27%, meals 20% and car rental 19%..
[Travel Pulse]

29. In general, January and March and September to October are the most expensive times to travel.
Demographics of business travelers.
Who is the average business traveler?
30. The average business traveler is male (63%) and aged between 35 and 54 year old (50%).
A recent survey has revealed that only 37% of business travelers are female .

31. Over half (56%) of business travelers are employed in a professional or managerial position.
32. business travelers make an average of $127,000 per year., 33. 66% of business travelers hold a bachelors’ degree., 34. a majority of business travelers, or 78%, travel alone on corporate trips..
Business travelers contribute to the rising number of solo travellers. In fact, 78% of them travel alone for business .
35. Nearly all (95%) business travelers will make reservations for their trip.
Top business travel destinations.
Where do people travel the most for business?
36. In 2021, the United States and Canada both ranked as the best-rated destinations for business and non-leisure travellers, each obtaining 6.4 in scores.
The scoring system is based on the Travel and Tourism Development Index (TTDI), on a scale from 1 (worst) to 7 (best).
Canada scored 6.4 in 2021 , ranking itself as one of two best-rated business and non-leisure travel destinations in the world.
37. They’re followed by Japan (6.2), China (6), and the UK (5.7), rounding up the top 5 business travel destinations.
UK remains as the fifth highest-rated destination for business travelers.

38. The main country destination for business meetings in 2021 was the United States (500 association events).
39. spain and japan, each with more than 360 events in 2021, ranked as the top second and third country destination for business meetings., 40. the us is also the country with the most conferences, business meetings, and trade shows planned between may 2022 and april 2023, with 33 thousand listed events., 41. the united kingdom has the second highest number of events planned for that period, with 6.4 thousand events listed across all industries., 42. in q4 2021, zurich was the most expensive city for business tourism, averaging $593 in daily cost..
Out of the top ten most expensive business travel destinations, three are Swiss cities, which shows just how expensive the country can be.
43. In Tokyo, the average daily cost for business travel is $517.
44. in terms of hotel cost, the most expensive business destination is new york, where a hotel room costs on average $376 per night..
With hotels having an average daily rate of $376 , New York is the most expensive destination for business trips.
45. Europe is expected to recover the most for US-originating trips in 2022. 25% of travelers say that they expect to take the same amount, if not more, business trips to Europe.
Purposes for business travel.
What is an example of business travel?
46. 43% of respondents in a survey say that sales visits are in the top two reasons for making international business trips in 2022.
47. the next driving reasons for international business trips in 2022 are leadership meetings (32%) and client-based projects (31%)., 48. surprisingly, conferences are only ranked as the top two reasons for sending employees overseas by 15% of respondents., employee perks and opinions in business travel, 49. 28% of employees who travel for work report that travel experience or satisfaction is the biggest pain point of their company’s travel program. , 50. meanwhile, only 13% of travel managers state that travel experience or satisfaction is the single greatest strength., 51. 41% of business travelers claim that cost savings outweigh employee satisfaction in their corporate travel program. 38% say that both factors are balanced, while 21% state that employee satisfaction is prioritized over cost efficiency., 52. 38% of business travelers are the least satisfied with the travel technology of their company., 53. the most desired perk by business travelers is the freedom to book with their favorite travel suppliers (46%)., 54. at 43%, the second most desired business travel perk is the permission to stay an extra night after the end of work meetings., 55. 39% of business travelers would like the ability to book their travels outside of the corporate travel agency., 56. 39% expressed a desire for companies to pay for leisure experiences during business trips., 57. however, a majority of travel managers (84%) state that their company would not consider offering bleisure options., 58. for 83% of employees, business travel is considered a job perk., 59. 79% of employees also say that the ability to travel affects job satisfaction., 60. 60% of job applicants report that a company’s travel policy influences their decision when considering an employer., 61. moreover, nearly 2 out of 5 millennial employees won’t accept a job that doesn't allow them to travel..
Almost 2 in 5 millennial employees will not accept jobs that don't allow them to travel.
Sustainability in business travel
62. 56% of business travelers state that lowering their carbon footprint is a moderate priority, whereas 21% believe that it’s a top priority. , 63. a majority of business travelers are willing to forego daily hotel cleaning (77%) to reduce carbon footprint., 64. to support the effort of reducing carbon footprint, most are also willing to use smaller cars (73%), fly premium less frequently (68%), travel less for work (63%), and take longer business trips at a time (56%)..

65. By 2025, 30% of companies expect sustainability to cause a 11% to 25% cutback in travel budgets.
Sustainability remains a priority for most companies, but they also expect that it will cause corporate travel spending to decrease.
Hotels and accommodation in business travel
66. in 2019, meetings and conferences made up 18% of hotel gross bookings..
This data was based on a 2020 Phocuswright study.
67. In a 2015 survey, business travelers comprise 40% of hotel guests.

68. In 2015, hotels generated $141.5 billion in business travel tax revenue alone.
69. corporate booking tools heavily rely on hotels as accommodation. only 9% offer alternative lodging., 70. almost half of companies surveyed in 2022 don’t offer nonhotel lodging reimbursement for their employees..

71. 12% of travel managers have succeeded in adding clauses that specify the availability of amenities for business events in hotels.
72. meanwhile, 10% of travel managers have considered adding such clauses, although they haven’t been successful in implementing them., 73. when airbnb for work launched as airbnb for business in 2014, their bookings tripled from 2015 to 2016..
[PhocusWire]
74. Then again, Airbnb for business bookings tripled from 2016 and 2017, while the number of companies using the platform hit 700,000 in 2017, almost double from the previous year.
In fact, Airbnb for Business was one of the top fastest-growing businesses within the company.
75. Out of the 60% of Airbnb for Work bookings with more than one guest, 40% of them have three or more guests.
This indicates a growing interest in collaborative business trips.
Business travel technology and accessibility
76. only 26% of travel managers claim that their corporate travel booking tool does a good job in accommodating employees with accessibility needs. , 77. meanwhile, a significant percentage of travel managers (37%) are not sure how well their company’s booking tool assists employees with accessibility needs. , 78. 78% of business travelers would like to see personalized search results based on previous purchases and travel loyalty status (78%)., 79. the same percentage (78%) is also interested in the ability to book multiple types of ground transportation., 80. moreover, 70% is interested in integrated access to risk intelligence information. this includes covid-19 infections and crime statistics in the local area..
This shows just how ready business travelers are for new booking-related innovations that can make the business travel experience more seamless.
Challenges and opportunities in business travel
What is the outlook of business travel?
81. 85% of business travelers stated that they need to travel to accomplish their business goals.
This was based on a GBTA survey in July 2022 of more than 400 frequent business travellers and nearly 48 decision makers.
82. More than 75% expect to make more business trips in 2023 than they did in 2022.
83. 84% of senior global corporate finance professionals are confident that travel spending would increase in 2023., 84. 73% of business travelers agree that inflation will impact business travel volumes in the future., 85. 69% of business travelers and 75% of global financial executives are worried that a possible recession will affect business travel., 86. most business travelers are ready to travel for work as much as they did before the pandemic. a total of 81% prefer to take the same amount (46%) or more (35%) business trips., 87. compared to wfh-dominant companies, those that implement more wfo policies are twice as likely to expect travel spending to recover to 2019 levels by the end of 2023., 88. over 30% of airbnb for work bookings include at least one weekend night, which shows that leisure is still common., covid-19 impact on business travel.
How did the Covid-19 pandemic affect business travel?
89. The share of companies canceling most or all domestic business trips worldwide reached 38% as of October 2021.
According to the Global Business Travel Association, 38% of companies canceled most or all domestic business trips in October 2021.
90. In that same month, nearly eight in ten firms delayed international business travel.
91. business travel failed to meet expectations in the second half of 2021, with approximately 33% of travel managers expecting to hit half of their 2019 spending in june 2021, but only 8% managing to reach that goal., 92. in 2021, business travel spending worldwide recovered by just 5.5% after having plummeted by over 50% in the previous year due to the coronavirus pandemic. , 93. 70% of providers and buyers of business travel services stated covid-19 travel restrictions hurt their business outcomes..
This data was gathered from a global survey in February 2022.

94. As a concrete example, Deloitte spent more than $583 million on air travel in 2019, but only $97 million in 2020.
This figure is surprising because Deloitte was the second leading air travel spender in the United States.
95. 58% of travel managers around the world expected that hotel prices would plummet during the Covid-19 pandemic.
96. 35.2% of travels buyers believe that travel digitization will increase after the covid-19 pandemic., 97. 72% of organizations are keeping online and hybrid meetings even after the pandemic ends., 98. as of february 2022, around 10% of employees across the globe were still unwilling or unsure to take business trips., 99. while pandemic-related concerns in corporate travel have fallen in 2022, increasing travel prices remain a huge barrier., 100. overall, the 2022 gbta business travel index concludes that the biggest challenges to faster recovery in global business travel include inflation, high energy prices, and labor shortages., 101. the economic slowdown in china and rising sustainability problems are also two major factors in the slow recovery of business travel worldwide..
That’s all about business travel for now!
We’ve learned the outlook of business travel, which despite being impeded by the Covid-19 pandemic will continue to recover and grow.
Do you think we missed any important aspect about business travel?
Leave us a comment below!
Check out these other statistics:
- Digital Nomad Statistics
- Family Travel & Tourism Statistics
- France Travel & Tourism Statistics
- RV Industry Statistics
- Investopedia
- ReportLinker
- StratosJets
- Travel Pulse

Leave a comment
Let us know what you think.

5 million people can't be wrong
Business Travel: 90+ Statistics, Facts, and Trends [2023]
Top 10 Business Travel Stats and Facts to Know in 2023
General business travel statistics, how covid-19 affected business travel, business travel outlook post coronavirus, what a typical business trip looks like, the portrait of a typical business traveler, travel manager statistics, corporate travel vs. sustainability, where do most people travel for business, stacking it all up, fair use statement.
The year 2020 was rough for business travel.
A full 90% of business trips were canceled, and the industry collapsed by 50%, resulting in billions of dollars in losses.
In 2021, business tourism managed to rise from its ashes. It first experienced a 14% growth, which jumped to 32% in 2022. Plus, the $700B industry is now forecast to be worth $2T by 2028.
So at Passport Photo Online, we’ve decided to compile a data-driven roundup of corporate travel statistics, facts, and trends for 2023 and beyond to help you stay in the loop.
Let’s dive in.

- Nine in 10 employees consider business travel a perk.
- Travel budgets account for 10% of companies’ overall expenses.
- New York is the most expensive US city for business travel, with a daily cost of over $500.
- 33% of businesses expect a reduction of 11–25% in travel budgets by 2025 due to the rollout of sustainability plans.
- Nearly 400M business trips occur in the US annually.
- Over 700K international business visitors came to the US in 2022, which is 80% less than in 2019.
- Business tourism supports 700K+ jobs in the US.
- Business travel expenditures in the US are expected to skyrocket by 180%, from $120B in 2020 to $350B in 2025.
- US business travelers take an average of two trips per month.
- Mexico is the leading international destination for US business travelers, accounting for about 33% of all trips.

Looking for passport photos? Discover more information:
- Take Baby Passport Photo at Home
- Passport Size Photos Maker
- Take Green Card Photo
- Business travel expenditures worldwide grew from $564B in 2001 to $1.4T in 2019.
- 82% of companies (with 1K+ employees) consider business travel essential. Here’s why:
- In 2019, Italy attracted the highest number of international business travelers, with nearly 15M annual arrivals (the US ranked fourth at 7M+.)
- Corporate travelers from Latin America spent almost $7B in the US in 2020, followed by the Asian-Pacific region ($2.5B) and Europe ($1.5B).
- Here’s a look at corporate travel spending by country in 2021:
- Although business travelers account for ~12% of all airline passengers, they bring ~75% of the profits.
- Here’s an overview of the number of trips business travelers take per month by industry:
- 80% of US business travel budgets go to domestic trips.
- In the 21st century, global business travel spending has only gone down three times, with the year 2020 being the harshest:
- In 2021, the global business travel expenditure dropped to $754B from $1.4T in 2019.
- Business travel spending in the US decreased by nearly 60% in 2020, plummeting from 2019’s $313B to $122B.
- Worldwide, business travel shrank by almost half, from $1.5T to $700B, causing over 2M people to lose their jobs.
- Here’s a look at the leading US companies in corporate travel in 2020 and how the pandemic affected them:
- Companies cut travel expenditures by 90% in 2021.
- Due to coronavirus variants and travel regulations, 92% of companies worldwide suspended most or all international travel in May 2021.
- In the case of domestic business flights, the cancellation rates peaked at 69% in March 2021 and kept lowering to ~30% in October 2021.
- Only 8% of companies say corporate travel rates in the second half of 2021 met the expected levels.
- COVID-19 caused 15% of companies to fundamentally rethink their travel policies.
- 71% of business travelers agree that COVID-19 created a greater need for face-to-face interaction, which can’t be satisfied with virtual means.
- With travel requirements loosening up, the rate of canceled business trips lowered to ~70% in October 2021 (from over 90% in 2020).
- Although COVID restrictions have been lifted, the number of flights canceled in the US in 2022 exceeded that of 2021.
- Around 122K flights had already been canceled by July 2022, compared to 121K in 2021.
- Over 60% of employees are optimistic about the recovery of business travel from coronavirus.
- International trips for US employees are expected to account for ~20% of overall business travel spending.
- 43% of workers were more likely to travel for business in 2022 than a year ago.
- Since 2020, business travel spending worldwide has grown by 26% annually.
- The global business travel market is projected to grow to $2T (+188%) by 2028.
- Spending on corporate travel was projected to reach half of what it was in 2019 by the end of 2022.
- Global business travel expenditures are expected to reach pre-pandemic levels by 2024.
- The US corporate travel is forecast to recover to 2019 levels by 2024, reaching $336B.
- Trips to headquarters may become a new business travel trend, as over 25% of WFH-dominant companies expect their employees to visit HQs regularly.
- 60% of global travel managers expected business travel volume to be higher in 2022 compared to 2021.
- Three days is the average length of a single corporate trip.
- One in three workers is away from home for as long as two weeks per month.
- Only ~66% of companies reimburse employees’ travel expenses to the HQ.
- Just 10% of companies book non-traditional lodging (e.g., private rentals).
- ~50% of companies reimburse employees for staying outside hotels.
- A domestic business trip cost around $300 per day in 2021.
- A typical business trip within the US is ~$900 per person.
- International corporate travel expenses reach over $2.5K per person.
- The median age of business travelers is 44.
- Most business travelers are Whites (72%), followed by Asians (14%), Hispanics (6%), and Black (5%).
- About 70% of corporate travelers are males, and 30% are females.
- Over 55% of business travelers spend ~6 days a month on the road.
- Roughly 33% of business travelers work entirely remotely.
- 64% of business travelers feel they are “on their own” when something goes wrong on the road.
- Nearly 40% of corporate travelers feel tired upon waking up.
- A third of business travelers have trouble falling asleep.
- Over 30% of business tourists consume alcohol frequently.
- 96% of travel managers use online booking tools (OBTs) when planning business trips.
- For 59% of travel managers, technology is one of the most critical aspects when it comes to picking a travel management company (TMC).
- 42% of travel managers consider tech one of the main disadvantages of their primary TMC.
- Eight in 10 companies say sustainability is vital to their travel program.
- 50% of organizations believe sustainability is “very important” or “extremely important.”
- Only 6% of companies are willing to pay extra for more sustainable travel options.
- Nearly half (49%) of businesses value financial savings over sustainability in business travel.
- 60% of corporate executives expect their companies to spend less on business travel in the future.
- Six in 10 travel managers believe their company will reduce business travel spending by 10% to meet sustainability goals.
- Just 1% of travel managers say their company could cut corporate travel expenditures by more than half to reduce emissions.
*None of the surveyed companies pointed to that initiative. But 11% of them consider implementing it in the future.
- 78% of employees say their company allows public transportation for business travel at least “sometimes.”
- 42% of business travelers use public transport “never” or “rarely.”
- Nearly half (47%) of corporate travelers use public transportation “sometimes” or “often.”
- Less than 2% of business travelers use alternative modes of transportation, such as electric scooters or bicycle-sharing apps.
- Although businesses consider sustainability information essential, only 44% of booking tools provide it.
- Half of business trips are to and from the company’s headquarters.
- Internal business trips are primarily made to engage with coworkers in person (37%) and meet with supervisors (36%).
- In-person meetings are the most desired format of business events worldwide, accounting for 42% of all meetings.
- In 2019, 18% of hotel bookings came from corporate meetings and conferences.
- 47% of global hoteliers expected business meetings and events to increase in 2022.
There you have it.
A comprehensive list of business travel statistics, facts, and trends to help you stay ahead of the curve.
Let us know in the comments if there are any other corporate travel stats you’d like to see.
Who travels the most for business?
Construction workers travel for business the most. They take an average of three trips per month.
How many people travel for business annually in the US?
In 2021, slightly over 180M people traveled for business in the US. It’s a significant drop from 400M+ business trips in 2019.
How often do workers travel?
On average, most employees (55%) travel for business fewer than six days a month. A quarter spends up to two weeks away from home, and around 8% travel for more than 20 days a month.
What percent of flyers are business travelers?
Business travelers purchase ~ 12% of airline tickets. Yet, they generate as much as 75% of airlines’ profits.
How long is the average business trip?
The average business trip lasts three days. Over half of all travelers take two corporate trips per month, resulting in six days on the road.
What percentage of airline revenue comes from business travel?
A full 75% of airline revenue comes from business travel. That’s because business travelers often pay as much as 3x (or more) the cost of an economy-class ticket.
Did you like our infographics? If so, feel free to share them with your audience. Just remember to mention the source and link back to this page.
- Amadeus, “The Future of Business Travel”
- American Hotel & Lodging Association, “Pandemic Recovery Impacting Business Travel Sentiment”
- Clark M., Minto R., Newsweek, “Flight Cancellations in 2022 Have Already Soared Past Last Year’s Total”
- Daher M., Crowley E., Caputo P., Jackson A., Terry B., Rauch M., “Reshaping the Landscape: Corporate Travel in 2022 and Beyond”
- Global Business Travel Association, FCM, “The Evolution of Travel Program Technology”
- Global Business Travel Association, Uber for Business, “The Corporate Travel Comeback: The Evolution of Ground Transportation and Other Trending Business Travel Topics”
- PwC, “Corporate Travel: Collaboration Is Essential for Successful COVID Recovery”
- Rundle, A., Revenson, T., Friedman M, “Business Travel and Behavioral and Mental Health”
- Statista, “Most Expensive Cities for Business Tourism in the United States in 4th Quarter 2021, by Average Daily Cost”
- Statista, “Most Expensive Cities for Business Tourism Worldwide in 4th Quarter 2021, by Daily Hotel Cost”
- Statista, “Average Business Travel Cost in the United States from 4th Quarter 2018 to 4th Quarter 2021”
- Statista, “Expected Average Number of Trips per Month by Business Tourists in the United States as of March 2022, by Organization Partner”
- Statista, “Expected Change in Revenue from Business Tourism for Travel Management Companies Worldwide as of January 2022”
- Statista, “Expected Change in the Volume of Business Travel Services Purchased by Travel Managers at Companies Worldwide as of January 2022”
- Statista, “Expected Change on Business Meeting Spend According to Hoteliers Worldwide in 2022”
- Statista, “Expenditure of Business Tourists from the United States from 2010 to 2020, with Forecast until 2025”
- Statista, “Expenditure of Business Tourists in G20 Countries in 2021”
- Statista, “Expenditure of Business Tourists Worldwide from 2001 to 2021”
- Statista, “Expenditure of International Business Tourists in the United States in 2020, by Region of Origin”
- Statista, “Favorite Formats of Business Meetings Planned Worldwide in 2022, by Region”
- Statista, “Leading Cities for Association Meetings Worldwide in 2020, by Number of Regional Events”
- Statista, “Leading Companies in Corporate Travel in 2019 and 2020, by United States Booked Air Volume”
- Statista, “Leading Countries for Association Meetings Worldwide in 2020, by Number of Regional Events”
- Statista, “Leading Host Countries for Conferences and Trade Shows Worldwide between May 2022 and April 2023, by Number of Events Planned”
- Statista, “Main Stress Aspects of a Business Air Trip According to Travelers Worldwide as of March 2022, by Stage of the Trip”
- Statista, “Market Value of the Business Travel Industry Worldwide in 2020, with a Forecast for 2028”
- Statista, “Number of Domestic Business and Leisure Trips in the United States from 2008 to 2019, with a Forecast until 2024”
- Statista, “Number of International Business Tourist Arrivals in Selected Countries Worldwide in 2019”
- Statista, “Number of Jobs Supported by Business Tourism in the United States from 2019 to 2021, by Segment”
- Statista, “Opinion of Travel Suppliers and Travel Management Companies on the Recovery of the Business Travel Industry from COVID-19 Worldwide as of February 2022”
- Statista, “Percentage Change in Expenditure of Business Tourists Worldwide from 2001 to 2021, with Forecast until 2025”
- Statista, “Share of Companies That Have Canceled Most or All Domestic Business Trips Worldwide from January to October 2021”
- Statista, “Share of Companies That Have Canceled Most or All International Business Trips Worldwide from January to October 2021”
- Statista, “Willingness to Travel for Business Purposes in the United States as of October 2021”
- Tourism Economics, US Travel Association, JD Power, “Business Travel Survey–2022 Q2”
- TripActions, “7 Business Travel Trends to Watch in 2020”
- Ye T., Xu H., “The Impact of Business Travel on Travelers’ Well-Being”

Adam is an SEO & Digital PR writer with a child’s curiosity about the surrounding world. His superpower to dig out juicy facts got him citations in Forbes, Social Media Today, and 90+ other news outlets. Adam enjoys snapping pictures and won the national Huawei Next Image Award.
33+ Business Travel Statistics for 2024
Top Business Travel Statistics
Business travel volume and frequency, global and regional business travel spending, costs and expenditures in business travel, corporate travel policies, stacking it all up.
Welcome to our curated and vetted list of 33+ business travel statistics for 2024.
In 2021, the global business travel market was worth $689.7B , and it’s expected to grow to $2.1T by 2031, with a 9.5% CAGR between 2022 and 2031.
- Global business tourism spending reached an estimated $1,357B in 2023, and it’s forecast to reach $1,782B in 2027.
- It’s estimated that US travelers will take 447M domestic business trips in 2024.
- Business travelers typically take about 1.8 trips monthly.
- In 2022, attending daily business meetings and events cost corporate travelers $160 .
Business travelers typically spend $1,018 per trip.
01. It’s estimated that US travelers will take 447M domestic business trips in 2024.
02. In 2024, the US is expected to see an 8% increase in domestic business trips compared to the previous year.
03. Business travelers typically take about 1.8 trips monthly.
04. Business travelers typically spend $1,018 per trip.
Sources: GBTA , Statista , US Travel Association #1 , US Travel Association #2
05. In 2021, the global business travel market was worth $689.7B, and it’s expected to grow to $2.1T by 2031, with a 9.5% CAGR between 2022 and 2031.
06. By 2024, global business travel is predicted to rebound to its pre-pandemic level of $1.4T and expand to almost $1.8T by 2027.
07. Global business travel spending will rise by 12.2% in 2024.
08. In 2023, China’s business travel spending was expected to hit $360.756B, with the US following at $329,123B.
09. Business travel made up 24.6% of the US’s tourism spending in 2022.
10. Though just 20% of trip volume, business travelers represent 40–60% of air and lodging revenue in the travel industry.
11. Business travel directly supported 1.3M jobs in 2022.
12. Amazon’s US air ticket purchases totaled $483M in 2022, making it North America’s top corporate travel spender.
13. The global meetings industry is expected to reach around $1.35B by 2024.
Sources: Allied Market Research , Business Travel News , GBTA , Next Move Strategy Consulting , Statista #1 , Statista #2 , US Travel Association
14. In 2022, attending daily business meetings and events cost corporate travelers $160.
15. The average business airfare ticket price was $749 in 2022.
16. In 2022, the average daily hotel rate for business travel was $161.
17. In Q4 2022, New York became the world’s most expensive city for business tourism, with an average daily cost of over $645.
18. In 2022, Fort Lauderdale was the US’s most expensive city for business travel in terms of car rental costs.
Sources: Business Travel News #1 , Business Travel News #2 , Skift
19. Some 86% of employees report that today’s uncertain economy affected their company’s business travel. 20. As of Q1 2023, 83% of executives view business travel as essential.

21. Over a third (38%) of workers believe business travel is crucial for keeping abreast of the latest trends, technology, and advancements.
22. A significant 62% of global business travelers feel they’ve lacked equal business travel opportunities compared to colleagues, often due to age, accent, or gender.
23. Nearly 35% of executives feel reduced business travel hinders their company’s competitive edge.
24. About 46% of corporate execs cite critical relationships as the top factor in authorizing travel for client visits.
25. Budget constraints within the company or department (36.5%) are the leading factor for restricting business travel.
26. The top reasons for business travelers skipping or calling off air trips for customer visits in the last year were the total flight time (40%) and the risk of delays or cancellations (26%).
27. Most executives (75%) favor employees extending business trips for leisure, with 86% endorsing remote work from anywhere.
28. Nearly half (45%) of business travelers add at least one leisure night to their business trips.

29. The main reason for extending business trips for leisure is exploring the destination (36%), followed by already-paid transport costs (31%).
30. Almost half (48%) of business travelers choose their own booking platforms.
31. Two-thirds (66%) of business travelers worldwide receive a corporate credit card from their company.
32. About 64% of business travelers with a corporate card add it to a mobile wallet.
33. Most (91%) business travelers would refuse an assigned trip if it conflicted with their needs, values, and preferences.
Sources: Concur , GBTA , Morning Consult , SAP News , US Travel Association
That concludes our deep dive into business travel statistics.
If you think this information would benefit your audience, you’re welcome to share it. Just remember to link back to this page as a nod to our efforts.
Is business travel increasing?
It’s estimated that US travelers will take 447M domestic business trips in 2024, up from 410M in 2023.
How big is the business travel market?
What companies spend the most on business travel.
Amazon’s US air ticket purchases totaled $483M in 2022, making it North America’s top corporate travel spender.
What’s the average cost of a business travel?

As a Digital PR specialist and a member of the Society of Professional Journalists (SPJ), I have 5+ years of writing experience. Over the course of my career, my work has garnered significant attention, with features in numerous prominent publications such as The New York Times, Forbes, Inc., Business Insider, Fast Company, Entrepreneur, BBC, TechRepublic, Glassdoor, and G2.
- Credit Cards
- Financial Services
- Investments
- Infographics
- Youtube Channel
Business Travel Statistics: Welcome Aboard, Frequent Flyer

People just don’t do business like they used to. With everything moving online, corporate executives are communicating via email and messaging apps around the globe, all day, every day.
But, there’s something about human interaction that will never go out of style. That’s why traditional corporate protocol still insists on face-to-face meetings. Whether it’s to close a multi-million dollar deal, or to simply attend an annual work convention, a good, old-fashioned sit-down does the trick.
Although business travel statistics showed a significant slowdown in the immediate aftermath of the 2008 financial crisis, business trips today are on the rise, proving to be one of the most valuable status symbols a company can afford.
So, let us walk you through the terminals of international airports, hotel lobbies, and high-class restaurants with these up-to-date business travel stats.

Revenue and Expenses
More than a quarter of global businesses rely on business travel..
(US Travel Association)
Nothing seals the deal like a good old handshake. Customers prefer to have in-person meetings, and companies owe them this privilege. That is why cutting on business travel is rarely posed as an option among big companies, as personal contact with clients is considered important.
According to Oxford Economics business travel statistics, if companies halted their travel policies and denied their customers meetings in person, they would lose approximately 25% of their current clients. This number fairs even higher when it comes to revenue, which would experience a drop of 28% if this nightmare scenario would suddenly turn real.
But that’s not all. An estimate of 36% of customers and 38% of the revenue would be lost in the manufacturing sector if companies were denied their right to use airplanes, trains, and cars to meet and discuss their businesses with clients in person.
Business travel made up about 26% of the total travel revenue in the United States in 2018.
(Global Business Travel Association) (US Travel Association)
The total travel output for 2018 was $2.5 trillion. While leisure traditionally takes up most of the revenue (around 74%), business travel is a constant contributor, with more than $292 billion in spending registered in 2017.
In 2018 US residents logged around 463 million domestic business trips, with 38% of the total number credited to traveling for meetings and events.
And the number is constantly increasing. According to US business travel statistics, the figure is set to rise to 493.7 million by 2022.
Compared to the global business travel revenue of $1.3 trillion in business travels, the United States is certainly a force to be reckoned with. With forecasters agreeing that this figure is to rise to more than $1.7 trillion by 2023, it seems that a huge chunk of the global revenue will still belong to American business travelers in the future.
Domestic business travel accounted for $111.17 billion in 2017.
While international spending averaged $31.6 billion in 2017, domestic business travel accounted for more than three times as much. However, while the average spending per domestic traveler was $949, international globetrotters spent an average of almost three times that much - an average person would spend as much as $2,600 on an international business trip.
But it is proven that business travel always pays off. For every dollar spent on business travel, companies see a $2.9 increase in profit and up to $9.5 increase in revenue.
Accommodation takes up an average of 13% of a business traveler’s budget.
(JTB Business Travel)
Hotel rooms can be expensive, especially when you’re doing business in a high-class metropolis like New York City. While motels, hostels, and Airbnb services are experiencing a rise in popularity among business travelers, hotels still reign supreme, especially within corporate business travel policies.
JTB Business Travel, which measures average prices per diem (per day) of hotels, transport, and meals purchased on business trips shows that New York is the most expensive US city for accommodation. An average New York hotel room costs $385.08 per diem.
If we consider that NYC is home to some of the biggest international hotel franchises like Ritz Carlton or Four Seasons, it’s no wonder that it takes up the flattering first spot. The second most expensive city in the United States is San Francisco at $379.37 per diem, with Boston coming third at $337.64.
In 2018, nearly 700,000 business travelers booked rooms with Airbnb for Work.
(Airbnb) (ZDNet)
Although hotels have a long tradition of accommodating business travelers, for the past few years, Airbnb is reversing the trend.
While domestic hotel rooms cost around $155 per night, Airbnb offers accommodation for only around $99. The company’s international prices are even lower - customers can book a room for an average of $75 as opposed to the $170 they would spend to book a hotel room.
78% of business travelers reported using Uber and other ride-hailing services.
(CNET) (Certify)
With a global market value of $72 billion, Uber has turned the world of taxi drivers upside down. They are becoming the number one choice for corporate travelers who need a lift on their business trips.
Taxi companies aren’t the only ones suffering from this surge of Uber popularity. The rental car service industry - which thrived on corporate executives traveling for business - is also feeling the blow.

In 2016, the market was still shared relatively fairly between ride-hailing and rental-car services. With 40% of travelers preferring to rent a vehicle, and 46% opting for ride-hailing, the only obvious losers were taxi services who only saw 14% the share.
However, in 2018, ride-hailing won the war with 78% of business travelers reporting to have used and preferred services of companies like Uber and Lyft. Rental cars saw a significant decline at 23% and taxi drivers were all but obliterated, falling to 6%.
In 2018 meals and incidental expenses made up $135.9 billion of total business travel spending.
Meals stack up 21% of expenses for an average business traveler. In addition to meals, companies also include incidental expenses into the traveler's allowance.
According to the 2019 edition of the Business Travel News Corporate Travel Index, meals are most expensive in New York, at $144.85 per diem. The runner-up is San Francisco with meal prices averaging $119.22 per diem, and Boston comes in third at $109.16 per diem.
At $495.1 million, Deloitte spent more on business travel expenses than any other US company.
As one of the Big Four accounting companies, Deloitte is a household name when it comes to expertise, professionalism and, of course, profit. When it comes to travel, Deloitte prefers to book flights, rather than any other means of transportation.
However, you don’t get to the top just by mindless spending alone. Due to its huge number of employees and a vast network of international divisions, Deloitte created a global procurement team in 2017 to handle the company’s global airline and hotel bookings.
Deloitte also implemented an automated airfare price assurance program, and strengthened its pre-trip review and approval processes, making booking faster, cheaper and easier. The majority of flights (72%) were conducted in the United States.
The second spot was reserved for IBM, at $430 million. The bronze went to PwC with $317.6 million spent to fund their employees' business trips. All of their business travel expenses were credited to various airlines.
Some airlines earn as much as 75% of their total revenue from business travelers.
(Investopedia)
Airlines get most of their revenue directly from passengers. While business travelers make up only 12% in numbers, they are every airline’s most valuable customer.
According to 2019 data, business travelers usually make up at least twice as much in terms of profit. With first-class tickets sometimes costing 10 times the price of coach tickets, business travel statistics like these come as no surprise.
The data implies that in some cases, airlines earn as much as 75% of their total revenue of trips booked by business travelers of all sorts.
This is mostly due to companies booking first-class tickets for their emissaries traveling across the country. While corporate travel policies have a history of saving money on business trips, in more recent years, this trend is being steadily reversed.
Managers now insist on providing their employees maximum comfort and convenience, since it reflects well on overall productivity. This has pushed airlines to compete with each other in terms of services they offer, continually offering new benefits.
In 2019, four US cities landed on the map of the world’s most expensive cities for business travel.
(CNN) (JTB Business Travel)
Los Angeles and San Francisco have landed on the list of the 10 most expensive cities for business travel. This is a significant jump compared to the year before when only Washington DC and New York held positions on the list.
NYC business travel statistics indicate that the Big Apple is the most expensive city for business travelers, mostly due to hefty hotel prices. Moreover, renting a hotel room in New York costs an average of $385 per diem.
Washington currently holds fourth place in expenses, with San Francisco, and Los Angeles, at seventh and ninth place respectively.
The other five cities worldwide are Zurich, Paris, Reykjavik, Basel, and Bern. The United States and Switzerland dominate the list, with four cities each.
Live chat with travel agencies, much like in-person meetings, improves business.
(Statista) (Kayako)
While this is not related to business travel exclusively, it is fairly indicative of which direction the travel industry is headed. Especially if we consider that 59% of US business travelers always book their hotel themselves and 30% usually book their hotel themselves.
In 2017, 79% of travel industry businesses reported an increase in revenue after enabling a live chat option on their website. Any way you look at it, investing in live chat has a huge influence on customer experience. In the short-term, companies that introduced live chat reported a significant increase in new customers. In the long-run, it does wonders for repeat business.

However, 38% of surveyed users consider a poor live-chat experience the number one reason for frustration when handling their travels.
Demographics and General Business Travel Statistics
Millennials are the fastest-growing group of business travelers in the united states..
Millennials are a rising force of the domestic economy in all sectors. This applies to business travel as well. According to a survey conducted by Skift, young adults in their late twenties/early thirties took 7.4 business trips in 2015.
Their older counterparts, popularly known as Gen Xers, were reported to have an average of 6.4 trips per year. Baby boomers came last with a 6.3 average.
While boomers prefer traditional accommodation, like hotels, younger travelers are more likely to go for non-chain hotels, Airbnb and other “room share” services. This is especially the case for millennials employed in the tech industry.
Also, travel statistics by age group suggest that the same target group most often uses low-cost air carriers, with 85% of them booking low-cost airlines in 2018.
On the other hand, ridesharing companies have experienced a huge growth in popularity among business travelers of all ages. As much as 81% of the survey’s respondents stated that they would take Uber or Lyft over taxis any day.
Millennials are 60% more-likely to purchase seats with extra legroom while flying, and spend some leisure time on their business trip.
(Forbes) (National Car Rental)
With 65% of millennials viewing business travel as a status symbol, additional legroom, as well as other benefits, are things they desire. That being said, they are also more likely to pay for additional headroom, roomier seats, and in-flight entertainment compared to the other two age groups.
Moreover, Millenials are most likely to consider business travel a perk when choosing a job, with nearly 90% of millennials seeking an advantage to extend their business trip into leisure. Other groups are not far behind, with 81% of Generation Xers and 80% of baby boomers also confirming that they like to make the most of the time they are given while away on business.
45% of millennials are prone to feeling guilty about mixing leisure with their business trips.
(Travel Agent Central)
While all business travelers like mixing business with leisure trips, they are also prone to feeling guilty about it. Around 45% of millennial respondents in a survey have reported having the so-called “bleisure travel stigma.” This means they believe they should avoid telling others about the fun times or personal activities they have on business trips.
While they are the least-likely to tell their bosses about their leisure time on business trips, millenials are most-likely to share photos of their adventures on social media.
However, regardless of their age or generation, managers (64%) and executive/senior leaders (67%) are also more likely to share their “bleisure” activities than non-managers (54 %) on social media.
This goes to show, as the employees become older and assume more senior positions within their companies, the stigma wears off. For example, 40% of Gen X respondents said they prefer keeping their personal activities during business trips private.
85% of frequent business travelers report having trouble balancing everyday work responsibilities while traveling for business.
(National Car Rental)
Employees that spend more than 88 days on the road per year showed an increase in breaking the business vs leisure barrier. “Bleisure” travelers reported working 9.1 hours a day, which is a whole hour less than the travelers who engage in strict travel for work purposes who clocked 10.1 hours on average per day.
The divide is real - 53% of business travelers state that finding time for leisure while on an official trip is next to impossible, as opposed to the 59% who manage to squeeze in some “me time” in the mix.
81% of all business trips in the United States are conducted by personal vehicles.
The majority of business travelers still prefer to use their personal vehicles as transport whenever they can. This is mainly due to the fact that 74% of all domestic business trips are conducted within less than 250 miles from the point of departure, with most of those being less than 100 miles.
However, as the distance gets longer, more people turn to air travel. Around 97% of 50-to 99-mile trips, as well as nearly 94% of 100-to-249-mile trips, are conducted by personal vehicles. Once the range reaches 250-to-499 miles, the personal vehicle share sharply declines to 67% while those in favor of airplanes surges to 31%.
While distances over 1,000 miles account for only 7% of the total number of business trips, they are almost exclusively conducted by air travel.
Attending a conference is the number one reason for business trips for all age groups.
Around 62% of all respondents in the Skift 2016 survey stated that the main reason for business travel is usually to attend a conference of some sort. This was the case with 74% of millenials, 61% of Gen Xers, and 53% of boomers.
The second biggest reason (56%) of travel was to attend a meeting with people from another company for the purposes of business planning or customer service. Millennials once again took the lead with 77%, with Gen Xers as second at 56%, and boomers at 39%.
The third reason is professional development or training, with an average of 44% of all respondents naming this as their purpose of business travel. Broken down into individual age brackets, the numbers come down to 63% of millennials, 43% of Gen Xers, and 25% of baby boomers.
Business traveler demographics report that women account for approximately 47% of all business travelers.
(Corporate Traveller)
While the usual stereotype implies that it is more common for men to take business trips, in recent years, the reality is closer to 50-50.
However, as women become more present in the business travel sphere, some specific safety issues arise. Female business traveler statistics focused on safety issues discovered that 90% of respondents named safety as the first thing that affected the activities pursued during personal time while on business travel.
The women who took part in the survey reported that such issues mostly affect their booking behavior (86%), where they prefer to exclusively book daytime flights, and rooms as close to the center of a city as possible.
Location is simply more important for women. For example, 84% cited that they tend to avoid cities and places that have a reputation for being unsafe. Furthermore, 81% indicated their travel frequency for business has also been affected by safety concerns, and 80% agree that such issues have had an impact on their productivity during business trips.
Nevertheless, the average business travel hotel user is still a middle-aged male.
As we’re all accustomed to seeing grey-haired men in suits and ties hanging around hotel lobbies, this fact is hardly a surprise. The average business travel hotel guest is male (63%), aged 35-54 (50%), employed in a professional or managerial position (56%) and earning an average yearly household income of $127,000.
As much as 78% travel alone, with the large majority of business travelers making reservations (95%). According to USA Today, The Hampton Inn and Suites was the favorite choice for corporate travelers in 2017.
Around 60% of companies have a travel policy, although employees prefer to handle booking themselves.
However, as much as 50% of surveyed companies allow travelers to book using any method they choose.
Furthermore, 46% of business travelers have reported preferring booking hotels on consumer sites and finding a better price, then relying on their company to do it for them.
As companies are led by other factors while choosing hotels, employees tend to think in more practical terms. That is why 37% of surveyed travelers reported having booked the hotels that were in the closest possible proximity of an established meeting place or conference location.
International Travel Statistics
China is the leading force when it comes to business travel spending..
(Global Business Travel Association) (CAPA)
With the United States spending more than $292 billion on business travel alone, China has reportedly reached a figure of $346.50 billion that funded their international corporate exploits.
China’s economic boom has launched the country’s corporate traveler to the very top of global business travel statistics. China dominates both regional and international statistics, with Japan and South Korea as traditional high-spenders in the region.
However, other players in the Asia-Pacific market, like India and Indonesia are making an appearance in the global business travel sector by growing at an incredible rate.
In 2014, India’s business travel market was worth $26 billion. Today it is forecast to reach $46 billion. As a country where economic activity is dominated by consumption, India’s business travel growth rate of 11.3 % is oriented more towards domestic than international.
On the other hand, Indonesia, which reported $17 billion in business travel spending in 2017, is a more trade-oriented country. This means that the country’s business-travel spending growth rate of 8.7% is focused on the international market rather than the domestic.
Europe is right behind China, holding 24% of total global business travel spending.
(Global Business Travel Association) (Blue Swan Daily)
Europe is home to some of the largest corporations in the world that rank the continent as second on a global scale when it comes to business travel spending. The largest part of this spending is attributed to developed Western European countries like Germany, the UK, and France.
In fact, a total of $364 billion in business travel spending was reported in Europe in 2017, with Western Europe claiming as much as $310 billion.
Traditional industrial powerhouses like Germany rated their business travel spending at about $72.07 billion in 2017, confirming the country’s unprecedented status in worldwide trade. France is also a powerhouse - the country spent more than $40 billion in 2016.
Spain spends around $20 billion in business travel, ranking 13th on the Global Business Travel Association’s list of the largest travel markets.
While most Western European economies have reported steady growth in business travel spending during the last few years, the United Kingdom has shown a 0.7% decline in 2017, largely due to the Brexit political crisis.
Further Reading
- The Most Powerful Passports Ranked
Frequently Asked Questions
1. how often do people travel for business.
An estimated 1.3 million business trips occur in the United States on a daily basis – 463 million trips per year in the United States alone.
2. How many business travelers fly each year?
Around 12% of the total number of flights is reserved by business travelers. In 2017 the US Department of Transportation reported that US airlines and foreign airlines serving the United States hosted 965 million domestic and international scheduled service passengers.
3. What percent of airline travel is for business?
Although business travelers make up only 12% in numbers, they are every airline’s most valuable customer. The data implies that in some cases, airlines earn as much as 75% of their total revenue of trips booked by business travelers of all sorts.
4. Do airlines charge business travelers more?
No. However, the circumstances of a typical business traveler affect the price of a plane ticket. Factors that usually affect the cost of flying for a business traveler are: flying on short notice, arranging a flight at a desirable time of day, and flying to a popular destination.

I have always thought of myself as a writer, but I began my career as a data operator with a large fintech firm. This position proved invaluable for learning how banks and other financial institutions operate. Daily correspondence with banking experts gave me insight into the systems and policies that power the economy. When I got the chance to translate my experience into words, I gladly joined the smart, enthusiastic Fortunly team.
More from blog

AppsThatDeliver
How-Tos, B2B Software Ratings & Reviews
Business Travel Statistics

Is there anybody you could think of who doesn’t like traveling? Maybe the answer is a big NO! People relish traveling. People like traveling to such an extent that they even forget to mail others or attend meetings or even listen to seminars during trips. The motto of business travelers is to work hard and play hard. They are happy to endure a morning full of meetings if it means they can spend the rest of the day enjoying.
This article is a compilation of everything you need to know about the most recent business travel statistics. Tighten your seat belts as we are going in for a tour on the latest business travel statistics now.
On this page, you’ll find:
General Business Travel Statistics
Business travel spending statistics, millennial business travel statistics, usage of technology in business travel, benefits and challenges in business travel, key business travel statistics.
Here is a list of the top 10 statistics from this article:
- Every year, around 445 million business trips are made. (Certify)
- From 2020 to 2027, the global market for business travel is expected to post a CAGR of 3% (Report Linker)
- In 2020, global business travel decreased by more than half to $694 billion . (Phocus Wire)
- As a result of the COVID-19 pandemic, corporate travel spending is expected to lose $820 billion . (CNBC)
- Corporate trips are viewed as a status symbol by 65% of business travelers who are millennials. (Forbes)
- Every year, millennials go on 7.4 trips. (Skift)
- Globally, 51% of passengers used a smartphone or other device to check-in online. (IATA)
- To manage their planning and booking needs, 57% of modern travelers want to have a single application. (Booking.com)
- Business travel is crucial to company growth according to 90.6% of corporate travel managers. (Skift, Trip Actions)
- For every dollar spent on corporate travel, companies get a $2.90 increase in profit and a $9.50 increase in revenue. (Certify)
Over the past few years, corporate trips have become more and more prevalent mainly because of the increasingly globalized business landscape. Every year, millions of business travel initiatives are launched. Across the globe, companies have understood the importance of investing in corporate travel. Let us first look into some of the general business travel statistics.
- In 2021, the global market for business travel is projected to decline by 4.5% (Report Linker)
- 12% of flight tickets are accounted for by business travelers. This represents 75% of the profits. (Investopedia)
- With an average cost of $515 per day, the most expensive business travel location in Asia is Hong Kong. (ECA International)
- In 2017, $1.33 trillion was spent on business travel globally. (GBTA)
- In Q2 2020, a 90% reduction in business travel was reported by U.S. airlines. (Spendesk)
- A loss of $162 billion for the U.S. economy was incurred in 2020 as a result of the reduction in travel spending. (U.S. Travel Association)
- As a result of the COVID-19 pandemic, 45% of respondents said that their company canceled most international business trips to the U.S. (Statista)
- Due to the COVID-19 pandemic, China lost $404 billion in business travel spend losses. (GBTA)
Undoubtedly, corporate travel is expensive. Accommodations that are affordable, secure, and trustworthy are required by business travelers. Millions of dollars per year are spent by companies on sending their employees on business trips. One should plan properly and create a budget ahead of time to ensure steady business travel funding. We shall now hop into some business travel spending statistics.
- As a result of the COVID-19 pandemic, corporate travel spending is expected to lose $820 billion . (CNBC)
- In the U.S., the average daily cost of business travel is $325 per day. (Business Travel News)
- Roughly $1,425 is spent by businesses for every employee they send on a business trip. (Fyle)
- Money for lodging ( 34% ), airfare ( 27% ), meals ( 20% ), and car rentals ( 19% ) is what the average business travel budget consists of. (Travel Pulse)
- $392 is the average domestic airfare in the U.S. (Business Insider)
- 21 to 121 days in advance of your preferred flight is the prime booking window, during which the fares are the lowest. (Cheap Air)
- From the point of their departure, 75% of business trips are less than 250 miles . (U.S. Bureau of Transportation Statistics)
- Business travelers account for 40% of hotel guests. (American Hotel & Lodging Association)
- Business travelers pay attention to quality ( 44% ), trustworthiness ( 38% ), convenience ( 40% ), quietness ( 30% ), affordability ( 28% ), and coziness ( 28% ) when it comes to accommodations. (CWT)
In the coming years, the majority of the workforce will be comprised of millennials. So, it is important to understand how millennial employees view business travel and how they travel for business. Millennials make sure that they can balance each trip for both business and leisure. In this section, we shall look into some statistics that emphasize millennial business travel.
- By opting for non-chain hotels, millennial business travelers in the tech industry prioritize cost-efficiency. (Travel Perk)
- During business trips, 78% of millennials intentionally make time for leisure. (Business Wire)
- For business, nearly 40% of millennials travel. (American Express)
- 16% of all business trips are taken by travelers aged 18 to 29 . (U.S. Bureau of Transportation Statistics)
- To go on business trips, 56% of millennials create reasons. (Forbes)
- The ability to book business travel on a third-party site satisfies 72% of millennial business travelers. (Statista)
- Traveling for work is a perk according to 75% of millennial business travelers. (Forbes)
- 41% of millennial men and 20% of millennial women agree that they should avoid having fun while on a business trip. (National Car Rental)
Corporate travelers are a bunch of tech-savvy. To manage their trips, they rely heavily on the internet and their smartphones. They also have a knack for learning new technology. When it comes to innovation, they have high expectations for their companies, travel agencies, airline companies, and similar firms. We shall now look into some statistics that throw light on the usage of technology in business travel.
- For business travelers to reconcile their expenses and payment data, it takes an average of 40 hours per month . (Egencia)
- 51% of corporate travelers say that in a few years, all business trip payments will be made via mobile devices. (Business Travel News Europe)
- 70.5% of all ground transportation receipts for business trips are comprised of ride-hailing companies. (USA Today)
- In the U.S., 39% of consumers who previously used ride-sharing say that they are planning to lessen their use of these services. (Car Gurus)
- In 2021, the total number of ride-sharing services is expected to reach 71.3 million users. (eMarketer)
- 55% of business travelers say that during out-of-town trips, they will allow employers to use GPS tracking to monitor their location. (Travelport)
- To provide them with significant travel suggestions, 41% expect travel brands to use AI. (Booking.com)
- To make last-minute purchases such as an additional bag, upgrade, or lounge access 27% of global passengers use an airline app. (IATA)
Some companies feel that business travel is passe or just a waste of time and money. However, most certainly this is not the case. Businesses can foster stronger and more close-knit relationships with potential clients and partners through corporate trips. Let us now look into some statistics on the benefits and challenges in business travel.
- Business travel is a job perk according to 83% of employees. (Stratos Jet Charters)
- The lack of formal processes and outdated booking systems are the factors that affect business travel. (Medium)
- Corporate travel policies are accepted by 69% of business travelers. (Lola.com)
- Flight delays ( 65.7% ), flight cancellations ( 31.9% ), and paying for travel expenses with a personal credit card ( 30.5% ) are the most common issues that business travelers face. (Skift, Trip Actions)
- The waiting time ( 27% ) and having no direct flights ( 25% ) are the most tiring aspects of business travel. (Fly Aeolus)
- Compared to 48% of people who miss travel to spend time with loved ones, only 6% of people miss traveling for business. (Airbnb)
- If employees travel without being vaccinated for COVID-19, then corporate travel and meeting planners will be concerned with their liability. (MMGY Global)
- Compared to pre-COVID-19 conditions, 36% of people expect to travel less for work when the COVID-19 pandemic gets over. (Airbnb)
Frequently Asked Questions
60% of airlines’ revenue comes directly from their passengers. Representing 75% of the profits,12% of flight tickets are accounted for by business travelers.
According to the most recent U.S. statistics, each year around 405 million long-distance business trips are taken by people.
An average of 6.8 trips per year is made by business travelers, while millennials in specific make an average of 7.4 trips per year.
In 2019, the World Travel and Tourism Council (WTTC) reported that the share of GDP generated by the business travel market reached 0.7 percent.
A few jobs that require business travel include management consultant, event manager, public accountants or auditors, public or media relations, and regional sales representative.
We have come to an end of this article and by now you would have understood the importance that companies give for carrying out business travel even in challenging times. Face-to-face meetings are crucial when one wants to build rapport, develop trust, and ensure coordination. This is why business travels are an essential part of many industries.
To conclude, we hope that this statistical list on business travel would have helped you in gaining a better idea of the state of the industry and where it is headed. With this information, one can prepare for their future business travel more easily.
Certify Report Linker Investopedia ECA International GBTA Spendesk U.S. Travel Association Statista GBTA Phocus Wire CNBC Business Travel News Fyle Travel Pulse Business Insider Cheap Air U.S. Bureau of Transportation Statistics American Hotel & Lodging Association CWT Forbes Skift Travel Perk Business Wire American Express Statista National Car Rental IATA Booking.com Egencia Business Travel News Europe USA Today Car Gurus eMarketer Travelport Skift, Trip Actions Stratos Jet Charters Medium Lola.com Fly Aeolus Airbnb MMGY Global
Author: Shubham Calmblay
Shubham Calmblay, founder of appsthatdeliver.com, has a decade of experience with various Google products. He has authored 1,000+ guides for ATD, published on prestigious tech blogs. His work has garnered recognition from Protocol.com, Leadsbridge.com, MadMobile.com, and numerous other leading publications and corporations.
All Posts by Shubham Calmblay
An official website of the United States government Here's how you know
Official websites use .gov A .gov website belongs to an official government organization in the United States.
Secure .gov websites use HTTPS A lock ( Lock A locked padlock ) or https:// means you’ve safely connected to the .gov website. Share sensitive information only on official, secure websites.
U.S. Business Travel
Americans make more than 405 million long-distance business trips per year, accounting for 16% of all long-distance travel (see Box A ), according to a preliminary analysis of the National Household Travel Survey (NHTS). Conducted from 2001 to 2002, the NHTS asked 60,000 people in 26,000 U.S. households about all trips they took in a given travel period and looked at the characteristics of those travelers and trips. This report examines early NHTS findings on domestic business trips to destinations at least 50 miles from home.
Trip Characteristics
Contrary to the stereotypical image of the business traveler heading off to catch a cross-country flight, the majority of long-distance business trips in the United States are taken to destinations within 250 miles of home and are by automobile. Nearly three-fourths (74%) are less than 250 miles from the point of departure and most of those are within 100 miles. Trips of over 1,000 miles account for only about 7% of all business trips. (See Figure 1 ).
Still, at 123 miles, the median one-way distance for business trips is greater than that for trips with other purposes. By comparison, the median distance for pleasure travel is 114 miles and for personal or family business trips the median distance is 103 miles. Long-distance commuting trips have a median distance of 69 miles.
The personal vehicle is the dominant travel mode for business travel, comprising 81% of all trips. Air travel accounts for about 16% of all business trips. The use of the two primary modes shifts, however, as trip distance gets longer. Almost all shorter trips are by personal vehicle—97% of 50 to 99 mile trips and nearly 94% of 100 to 249 mile trips. In the 250- to 499-mile range, the personal vehicle’s share of trips declines to 67%, while the airplane accounts for 31% of the trips.
Only after the 500-mile mark does the car give way to the airplane as the dominant mode of business travel. For trips 500 to 749 miles in length, air captures 64%, compared to 33% by personal vehicle. Of business trips between 750 and 1,500 miles, air captures almost 85%, and of trips more than 1,500 miles in distance, a full 90% are made by air. Accordingly, this yields a median trip distance for business travel by car of 102 miles, but one of 816 miles for business travel by air.
Where are They Traveling?
Because the majority of business trips are less than 250 miles in length, it is not surprising that 84% of business trips (341 million business trips) do not cross census region boundaries 1 ( Figure 2 ).
The origins and destinations of the 64 million inter-regional trips are not evenly distributed. The West attracts 7.4 million more inbound business trips than it sends to other regions. The South, on the other hand, has 7.7 million fewer inbound business trips than outbound. There is no statistically detectable difference between the inbound and outbound flows 2 in the Northeast and Midwest. The South is the largest destination for outbound business trips from each region. Also, the South is the largest generator of inbound business trips to each of the other regions.
Traveler Profile
The typical business traveler is likely to be male; work in a professional, managerial, or technical position; be 30 to 49 years old; and have an income well above the population average.
Men account for more than three-fourths (77%) of business trips. This compares to nonbusiness travel where men take 54% of the trips and women 46%.
Those who consider their occupation to be professional, managerial, or technical account for over half (53%) of all business trips. This occupational category represents only about 40% of the general population. Sales or service workers account for the next largest share of business trips, 28%. On the other hand, clerical/administrative workers account for less than 4% of business trips even though they represent almost 12% of the population.
About 55% of all business trips are made by individuals aged 30 to 49. Those in their thirties take 28% of the trips while comprising 16% of the population. Those in their forties take 27% of the trips while comprising 15% of the population. The percentage of trips represented by those in their fifties drops markedly, with only 18% of business trips represented by this age group. Overall, this age group accounts for about 11% of the population. The youngest and oldest groups of adult business travelers, 18 to 29 and 60+ years old, represent about 16% and 10% of business trips, respectively.
Business trips are generally made by those with household incomes that exceed the national average, which is about $47,500, according to the Bureau of Labor Statistics. Although 12% of households have annual incomes of $100,000 or more, the NHTS survey found that this income group accounts for over one-fourth (27%) of business trips. Another 18% of trips are made by those with household incomes between $75,000 and $99,000. There are relatively few low-income business travelers. Although 21% of households have incomes of $25,000 or less, only 6% of the business trips are made by that income group.
Source and Accuracy
The findings from the 2001 NHTS survey are based on travel data collected from a random digit dial sample of telephone interviews conducted with over 60,000 individuals in approximately 26,000 nationally representative households. Interviews were conducted between March 2001 and May 2002. Individuals in the NHTS sample were asked to complete a travel diary for a specified day, known as the travel day, and were also asked to report on the characteristics of long-distance trips of 50 miles or more from home made during a 4-week period, known as the travel period.
Estimates reported here are based on weighted data to account for selection probabilities at the household and individual level, and are further adjusted for household and individual nonresponse. Comparisons made in this report are statistically significant at a 0.05% level.
About the 2001 NHTS
The 2001 National Household Travel Survey (NHTS) updates information gathered by two series of travel surveys—the Nationwide Personal Transportation Survey (NPTS) conducted in 1969, 1977, 1983, 1990, and 1995 and the American Travel Survey (ATS) conducted in 1977 and 1995. Results from this report are from preliminary data collected in the long-distance travel section of the survey.
1 The Bureau of the Census divides the country into four reporting regions.
2 Inbound flow is the number of trips to a Census Region originating from another Census Region. Outbound flow is the number of trips from a Census Region with the farthest destination in any other Census Region.

When it comes to spending, the business travel industry has long COVID
T he classic business-class road warrior has been keeping it in park. Though corporate business travel is expecting to surpass pre-COVID-19-levels on a nominal basis this year, the Financial Times reports that the Global Business Travel Association doesn’t expect inflation-adjusted spending to hit 2019 levels again until 2027.
Suzanne Neufang, the group’s CEO, told the newspaper that “inflationary pressures and other things means [travel companies] are making more money on fewer trips” and that “the way companies travel is different,” resulting in “a new normal and that is probably here to stay.”
The consulting firm Deloitte recently explained what that new normal looks like: Fewer travelers doing more of the traveling. Southwest Airlines (LUV) , which just started giving its customers assigned seats for the first time recently, said that trying to curry favor with business travelers was part of the rationale for doing so.
“Customers are just taking fewer short-haul trips today, they are flying longer,” said CEO Bob Jordan. “And when they fly longer, the importance of an assigned seat goes up. We’ve talked a lot about our desire and initiatives to grow market share with corporate business travelers in the managed business space, and their preference is for an assigned versus an open seat.”
For the latest news, Facebook , Twitter and Instagram .

Hello. It looks like you’re using an ad blocker that may prevent our website from working properly. To receive the best experience possible, please make sure any blockers are switched off and refresh the page.
If you have any questions or need help you can email us
Americans Taking Longer Weekend Trips, Spending More in 2024
Between May and September, seven in ten (73%) Americans will travel away from home for at least one night, promising a busy summer travel season this year.
Isaac M. O'Bannon
Aug. 07, 2024

Americans are planning to take longer stretches of time off this summer, according to Allianz Partners USA ‘s 16 th Annual Vacation Confidence Index. New research indicates that travel remains a strong priority based on an increase in both average trip length and average spend on room nights, with staggering splurge statistics reported for three-night getaways.
As both travel and confidence have rebounded in recent years, the average number of nights spent away per trip has been steadily creeping up and now sits at 4.6 versus 4.5 (2023), 4.3 (2022), and 4.1 (2021) nights away. The “micro-cation” trend – previously coined by Allianz Partners USA and characterized as a leisure trip of four nights or fewer – is seemingly growing less popular as travelers opt to spend more nights away on vacation.
Between May and September, seven in ten (73%) Americans will travel away from home for at least one night, promising a busy summer travel season this year. Two in five of those surveyed (41%, up two points from 2023) also are planning ‘multi-cations,’ or multiple getaways at least 100 miles from home for at least a night – an increase over the years past (39% in 2022 and 34% in 2021) and an all-time high. This year’s findings spotlight the continued importance Americans are placing on travel, with 16% taking at least three trips away this summer.

Length of time spent away isn’t the only travel indicator that’s creeping up, according to the 16 th Annual Vacation Confidence Index. With summer vacation spending expected to hit an all-time high of $221 billion in 2024, it comes as no surprise that average cost per night is also on the rise. Long weekends and summer Fridays have captivated the American traveler – those who are still opting for micro-cations and taking three-night vacations are more likely to splurge at a rate of $587 per night, a figure that has almost doubled since 2022.
Budget is of less concern for those jetting off for one night, and one night only, with trip spend averaging a similar $594. When tacking on a second night, travelers plan to spend $865 total, bringing the nightly cost down to $433. The best value is found for the popular four-night trip, with average spend dipping down to $385, as well as the 6-7 nights range, with travelers shelling out $406 and $401 per night, respectively.
“From cityscapes and mountainsides to coastlines and canyonlands, this summer promises a jam-packed travel season as Americans look to plan multiple trips at a growing average length. Whether splurging for a long weekend or finding added value on longer getaways, travelers are making the most of their time off this summer,” said Daniel Durazo, director of external communications at Allianz Partners USA. “Frequent trip planners, or those taking ‘multi-cations,’ may want to consider an annual travel insurance policy, which offers not only convenience and value, but also peace of mind in the form of trip protection that can last for an entire year.”
ABOUT CPA PRACTICE ADVISOR
- Cookie Policy
- Terms & Conditions
Magazines & Newsletters
- Magazine Archive
- Newsletters
CPA Practice Advisor is registered with the National Association of State Boards of Accountancy (NASBA) as a sponsor of continuing professional education on the National Registry of CPE Sponsors.
© 2024 Firmworks, LLC. All rights reserved
- Travel, Tourism & Hospitality ›
Business Travel
Industry-specific and extensively researched technical data (partially from exclusive partnerships). A paid subscription is required for full access.
Average cost of domestic business trips in the U.S. Q3 2013-Q1 2020
Average domestic business trip cost in the united states from 3rd quarter of 2013 to 1st quarter of 2020 (in u.s. dollars).
To access all Premium Statistics, you need a paid Statista Account
- Immediate access to all statistics
- Incl. source references
- Download as PDF, XLS, PNG and PPT
Additional Information
Show sources information Show publisher information Use Ask Statista Research Service
United States
Q3 2013 to Q1 2020
Includes air, hotel and car rental costs. Select domestic trip class to retrieve data.
Other statistics on the topic
- Global business travel spending 2001-2022
- Biggest corporate travel spenders in the U.S. 2022, by booked air volume
- Top U.S. travel management partners 2020
- Daily business tourism expenses in the United States 2018-2021

To download this statistic in XLS format you need a Statista Account
To download this statistic in PNG format you need a Statista Account
To download this statistic in PDF format you need a Statista Account
To download this statistic in PPT format you need a Statista Account
As a Premium user you get access to the detailed source references and background information about this statistic.
As a Premium user you get access to background information and details about the release of this statistic.
As soon as this statistic is updated, you will immediately be notified via e-mail.
… to incorporate the statistic into your presentation at any time.
You need at least a Starter Account to use this feature.
- Immediate access to statistics, forecasts & reports
- Usage and publication rights
- Download in various formats
* For commercial use only
Basic Account
- Free Statistics
Starter Account
- Premium Statistics
The statistic on this page is a Premium Statistic and is included in this account.
Professional Account
- Free + Premium Statistics
- Market Insights
1 All prices do not include sales tax. The account requires an annual contract and will renew after one year to the regular list price.
Statistics on " Business travel in the United States "
- G20 nations: business travel spending 2021
- Share of tourism spending in leading global travel markets 2022, by type
- Number of business travel jobs in the U.S. 2019-2021
- Readiness of U.S. travelers to take business trips 2021
- Business travel volume in the U.S. 2010-2021
- Growth rate of domestic business trips in the U.S. 2017-2026
- Inbound business tourism volume in the U.S. 2011-2021
- Main source countries for U.S. inbound business travel 2022
- Average monthly trips by U.S. business travelers 2022, by type
- U.S. inbound business travel spending 2010-2021
- U.S. inbound business travel spending 2020, by source region
- Main source markets for U.S. inbound business travel spending 2020
- U.S. outbound business travel spending 2010-2021
- Main recipient countries of U.S. outbound business travel spending 2020
- U.S. domestic business travel spending 2019-2026
- Highest-priced U.S. business travel destinations Q4 2023
- Favorite hotel brands for corporate travel during COVID-19 in the United States 2021
- Predictions on reduction of U.S. corporate travel spend due to green goals 2025
- Predictions on corporate travel spending in the United States 2022, by destination
- Adoption of digital nomads' way of living in the U.S. 2022
- Major reasons to take bleisure trips for U.S. business travelers 2022
- Favorite trip length for U.S. bleisure travelers 2022
- Favorite countries for U.S. Americans to work remotely 2021
- Most important features at accommodations for U.S. bleisure travelers 2022
- Workation destination choice of remote workers from the U.S. 2021
- Motivations of U.S. Americans who work remotely to choose workation 2021
- Duration of workations by U.S. Americans who work remotely 2021
- Main concerns of U.S. remote workers when picking workation lodging 2021
- U.S. remote workers' satisfaction with workation experience 2021
Other statistics that may interest you Business travel in the United States
- Premium Statistic Global business travel spending 2001-2022
- Basic Statistic G20 nations: business travel spending 2021
- Basic Statistic Share of tourism spending in leading global travel markets 2022, by type
- Premium Statistic Number of business travel jobs in the U.S. 2019-2021
- Premium Statistic Readiness of U.S. travelers to take business trips 2021
Volume of business tourism
- Premium Statistic Business travel volume in the U.S. 2010-2021
- Premium Statistic Growth rate of domestic business trips in the U.S. 2017-2026
- Premium Statistic Inbound business tourism volume in the U.S. 2011-2021
- Premium Statistic Main source countries for U.S. inbound business travel 2022
- Premium Statistic Average monthly trips by U.S. business travelers 2022, by type
Business travel spending
- Premium Statistic U.S. inbound business travel spending 2010-2021
- Premium Statistic U.S. inbound business travel spending 2020, by source region
- Premium Statistic Main source markets for U.S. inbound business travel spending 2020
- Premium Statistic U.S. outbound business travel spending 2010-2021
- Premium Statistic Main recipient countries of U.S. outbound business travel spending 2020
- Premium Statistic U.S. domestic business travel spending 2019-2026
- Premium Statistic Daily business tourism expenses in the United States 2018-2021
- Premium Statistic Highest-priced U.S. business travel destinations Q4 2023
- Premium Statistic Biggest corporate travel spenders in the U.S. 2022, by booked air volume
- Premium Statistic Top U.S. travel management partners 2020
- Premium Statistic Favorite hotel brands for corporate travel during COVID-19 in the United States 2021
- Premium Statistic Predictions on reduction of U.S. corporate travel spend due to green goals 2025
- Premium Statistic Predictions on corporate travel spending in the United States 2022, by destination
Bleisure travel
- Premium Statistic Adoption of digital nomads' way of living in the U.S. 2022
- Premium Statistic Major reasons to take bleisure trips for U.S. business travelers 2022
- Premium Statistic Favorite trip length for U.S. bleisure travelers 2022
- Premium Statistic Favorite countries for U.S. Americans to work remotely 2021
- Premium Statistic Most important features at accommodations for U.S. bleisure travelers 2022
Travel behavior of remote workers
- Premium Statistic Workation destination choice of remote workers from the U.S. 2021
- Premium Statistic Motivations of U.S. Americans who work remotely to choose workation 2021
- Premium Statistic Duration of workations by U.S. Americans who work remotely 2021
- Premium Statistic Main concerns of U.S. remote workers when picking workation lodging 2021
- Premium Statistic U.S. remote workers' satisfaction with workation experience 2021
Further related statistics
- Premium Statistic Average cost of U.S. international business trips Q3 2013-Q1 2020
- Premium Statistic Main European countries for inbound business travel spending in the UK 2021
- Premium Statistic Most expensive cities for business travel APAC Q4 2022, by hotel cost
- Premium Statistic Most expensive cities for business travel APAC Q4 2022, by meal cost
- Premium Statistic Global business travel spending forecast 2023-2027
- Premium Statistic Quarterly number of Norwegian business travelers 2017-2020, by type
- Premium Statistic Distribution of business travel expenses of Italian companies 2019, by type
- Premium Statistic Global business travel spending 2019-2020, by region
- Premium Statistic Average daily spending per person on business trips in Germany 2006-2022
- Premium Statistic Business travel spending of China 2013-2027
- Premium Statistic Business travel spending in Italy 2010-2025
- Premium Statistic Selected business trip costs in Canada 2013
- Premium Statistic Highest-priced U.S. business travel destinations Q4 2023, by daily hotel costs
- Premium Statistic Business travel spending in Brazil 2010-2025
- Premium Statistic Travel spending of inbound visitors in Chile 2010-2020, by purpose
- Premium Statistic Italy: improvement of hotel loyalty programs in 2017
Further Content: You might find this interesting as well
- Average cost of U.S. international business trips Q3 2013-Q1 2020
- Main European countries for inbound business travel spending in the UK 2021
- Most expensive cities for business travel APAC Q4 2022, by hotel cost
- Most expensive cities for business travel APAC Q4 2022, by meal cost
- Global business travel spending forecast 2023-2027
- Quarterly number of Norwegian business travelers 2017-2020, by type
- Distribution of business travel expenses of Italian companies 2019, by type
- Global business travel spending 2019-2020, by region
- Average daily spending per person on business trips in Germany 2006-2022
- Business travel spending of China 2013-2027
- Business travel spending in Italy 2010-2025
- Selected business trip costs in Canada 2013
- Highest-priced U.S. business travel destinations Q4 2023, by daily hotel costs
- Business travel spending in Brazil 2010-2025
- Travel spending of inbound visitors in Chile 2010-2020, by purpose
- Italy: improvement of hotel loyalty programs in 2017
Mountain View, CA
Mountain View
Around the Globe
Hurricane tracker, severe weather, radar & maps, news & features, winter center, news / hurricane, hurricane season update: what the us can expect into september, october.
The Atlantic hurricane season is about to ramp up with a barrage of tropical storms and hurricanes, and AccuWeather forecasters warn the season could approach record-setting levels.
By Brian Lada , AccuWeather meteorologist and staff writer
Published Aug 14, 2024 7:18 AM PDT | Updated Aug 14, 2024 11:24 AM PDT
From its first landfall in Florida to the second landfall in the Carolinas to wide-reaching flooding in the Northeast, AccuWeather was there to cover all of Debby’s impacts.
The peak of the Atlantic hurricane season is right around the corner, and it is about to shift into gear around the same time that the calendar flips from August to September.
AccuWeather meteorologists have not wavered since the initial forecast was released on March 27, 2024, holding steady with predictions of a near-historic Atlantic hurricane season.
As of Aug. 14, five tropical systems, including two tropical storms and three hurricanes, had already formed. By the end of the year, AccuWeather expects 20-25 named storms and 8-12 hurricanes to form. Hurricane Beryl and Hurricane Debby both made landfall in the United States, and another two to four direct impacts are predicted.

Hurricane forecast through late August
Other than Ernesto, which is currently swirling off the East Coast of the United States, not much activity is anticipated through Aug. 24.
"It looks like that over the next 10 days or so tropical activity will be suppressed across the Atlantic due to another batch of dry Saharan dust that is moving off of Africa," AccuWeather Lead Hurricane Expert Alex DaSilva said. "I think things could pick back up during the last week of the month and into September, as it looks like the dust will decrease."
This aligns with the peak of the Atlantic hurricane season, which occurs around Sept. 10.
What areas face the highest risk of a landfalling tropical system
"We continue to remain concerned about the Texas coast, Florida Panhandle, South Florida and the Carolinas of seeing direct impacts for the rest of the season," DaSilva explained.
Florida and Texas have already been hit by landfalling hurricanes, and those same areas could face another brush with a tropical storm or hurricane before the season is over.

A satellite image of Debby as it made landfall as a Category 1 hurricane on Aug. 5, 2024. (AccuWeather)
Although the climatological peak of the hurricane season is Sept. 10, AccuWeather predicts the Atlantic basin will continue to churn out tropical storms and hurricanes throughout October and even into November.
Why this hurricane season is predicted to be so busy
"Sea-surface temperatures and ocean heat content are near record levels across most of the Atlantic basin. This can act like jet fuel for tropical systems," DaSilva said.
As of Aug. 13, the ocean temperatures across the northern Atlantic Ocean were significantly above the long-term average and could climb even higher through early autumn.
The unusually warm water can promote more tropical storms and hurricanes and quickly boost their strength. DaSilva is "very concerned" about the potential for systems to rapidly intensify, especially on their final approach to making landfall.

The other big driving factor is the likely emergence of La Niña this fall.
When water temperatures near the equator of the eastern Pacific Ocean are lower than the long-term historical averages for an extended period of time, La Niña is declared. Although this is a phenomenon in the Pacific, it has ramifications for weather patterns over the Atlantic Ocean. Specifically, La Niña can reduce the disruptive winds across the basin, known as wind shear . When wind shear is lower, it makes it easier for tropical systems to take shape and strengthen.
Forecasters may run out of names for storms
Every year, meteorologists use a list of 21 names to identify each tropical storm and hurricane, but with up to 25 storms predicted this season, forecasters could run out of names.
If the list is exhausted, forecasters will have to use a supplemental list of names for the first time ever .

In previous hyperactive years, the World Meteorological Organization (WMO) used the Greek Alphabet to name storms. However, following the record-breaking 2020 season, which had 30 named storms, they changed the rules and created a backup list of storm names.
The supplemental list of names is in alphabetical order, with the first name being Adria.

Continue Reading:

Want next-level safety, ad-free? Unlock advanced, hyperlocal severe weather alerts when you subscribe to Premium+ on the AccuWeather app . AccuWeather Alerts ™ are prompted by our expert meteorologists who monitor and analyze dangerous weather risks 24/7 to keep you and your family safer.
Weather News

Dangerous rip currents from Ernesto to impact US Atlantic beaches

California kayakers' great white shark encounter caught on camera

When might summer weather return to the northeastern US?
AccuWeather Early
Hurricane center.
Top Stories
Trending Today
Forecast victories.
Ernesto to become a major hurricane, threaten Bermuda, Canada
5 hours ago

Hurricane season update: What the US can expect
12 hours ago

2 women struck by lightning at Glen Canyon National Recreation Area
13 hours ago

Weather Forecasts

Search for suspect after bulldog was left to die in taped container
14 hours ago

Featured Stories

Is pumpkin spice a summer flavor? IHOP and others say yes
19 hours ago

The ‘Hidden Valley’: Tourists wade through water to secret waterfall

Meet ‘Eve’ the DNA-collecting robot fish

Florida’s Python Challenge offers military vets a chance to heal

We have updated our Privacy Policy and Cookie Policy .
Get AccuWeather alerts as they happen with our browser notifications.
Notifications Enabled
Thanks! We’ll keep you informed.
Travel companies rein in their forecasts as US consumers cut spending
- Medium Text

- Lower-income earners delay vacations as savings dwindle, economic outlook uncertain
- Hilton, Marriott see minimal leisure travel growth; international revenue offsets U.S. demand
- Airbnb and Booking Holdings report slowing U.S. growth, last-minute bookings increase
Sign up here.
Reporting by Doyinsola Oladipo in New York; Additional reporting by Aiswarya Jain in Bengaluru; Editing by Matthew Lewis
Our Standards: The Thomson Reuters Trust Principles. , opens new tab

Japan's economy rebounds strongly on consumption boost, backs case for more rate hikes
Japan's economy expanded by a much faster-than-expected annualised 3.1% in the second quarter, rebounding from a slump at the start of the year thanks to a strong rise in consumption and backing the case for another near-term interest rate hike.

- Share full article
Advertisement
Supported by
Is a Disney Theme Park Vacation Still Worth the Price?
As Disney has raised the cost of tickets and hotel rooms at its theme parks, and added pricey, difficult-to-navigate tools, even its most loyal fans are asking themselves if they should rethink their vacations.

By Tariro Mzezewa
Earlier this year, Jake Williams, a filmmaker and content creator in Toronto, made his long-awaited return to one of his favorite places on earth: Walt Disney World in Orlando, Fla. After traveling to Disney World and Disneyland multiple times a year since childhood and becoming an annual pass holder as an adult, Mr. Williams hadn’t been to a Disney park since 2019.
“As someone who went all the time, it’s crazy to me that I hadn’t gone to a Disney park in that long,” he said in a phone interview. “It’s a special place. ”
Before his trip, Mr. Williams heard about some changes at Disney World, but he didn’t anticipate how different things would be, starting at the airport. Since his last visit, the company had gotten rid of the Magical Express, a free bus that for more than 15 years shuttled people from Orlando International Airport to their Disney resorts. Guests must now take a shuttle that costs between $23 and $30 per adult each way, depending on the time of year, use a ride share service or rent a car.
To Disney-goers, the end of the Magical Express speaks to a larger issue: The cost of being at the happiest place on earth is going up while the perks are going away. As the company has raised the price of tickets and hotel rooms, and added costly, difficult-to-navigate tools to book rides as replacements for previously free products, even its most loyal fans are asking themselves if it’s still worth it.
Mr. Williams said that a day in the Orlando parks and a one-night stay at Disney’s Port Orleans Riverside Resort cost a “jaw-dropping” $886.34 for two adults. He decided to calculate how much the same trip cost in 2017 — a year when he visited the park several times. The cost: $567.90. Even accounting for inflation, he was stunned.
“It’s hard to justify going to Orlando rather than, like, Iceland,” he said. “When you have a budget like this, you can go a lot of places and see and do a lot of things. You could even do a Disney cruise for less than that.”
Epcot’s Italy, or Italy?
He’s not alone. Len Testa, president of Touring Plans , a site that helps travelers organize Disney trips, and a co-author of “The Unofficial Guides to Walt Disney World and Disneyland,” said that he increasingly hears from Disney lovers who are now planning other types of vacations.
“At some point a Disney vacation starts competing with ‘Let’s go see Europe’ and I think that’s what a lot of people are doing,” Mr. Testa said. “I’ve had a number of people in the last few years say, ‘We priced it out and we could take our children to eat pizza in the Italy pavilion in Epcot or for the same money we could actually go to Italy for two weeks. We’re going to go to Italy for two weeks.’”
For Mr. Testa, collecting data about Disney is a passion. In the late ’90s, as a graduate student in computer science he decided he wanted to build a computer program that could help people navigate Disney World as efficiently as possible. That research continued through his Ph.D and the program he created turned into Touring Plans. His team of developers and data scientists model what’s going on at Walt Disney World on a minute-by-minute basis every day. The data they’ve collected in recent years shows that the cost of a Disney World trip, on average, has gone up almost 25 percent since 2019. Seventy percent of that increase is for services that used to be free.
The prices of parking and entry tickets have consistently risen in recent years. In 2022 ticket prices went up two times. In 2023 annual passes saw a $30 to $50 increase, depending on the tier, while multiday tickets also went up. A one-day ticket to either of Disney’s U.S. parks now costs $109 for anyone over the age of 10.
One analysis concluded that between 2014 and 2025, the base price for tickets has gone up 32 percent and increased by 90 percent for the highest-priced tickets. In 2025 the base price for an adult one-day ticket will be $119 and the higher tickets will be $199. Hotel prices have also risen. The cheapest hotels at Disney World now cost an average of $187 per night, according to Disney Magic Guides , a resource for planning trips to the parks.
In an earnings call this week , Disney’s leaders acknowledged that they’ve seen a slowdown at the parks and that, because of the economy, lower-income visitors are financially stressed, while higher-income guests are traveling internationally. And Disney is not alone: Tickets for Universal Studios in Florida and in California often cost as much as Disney tickets. In July, Comcast said Universal’s revenue fell by 11 percent in the prior quarter, with visitors turning to cruises and international travel.
In an email, a spokeswoman for Disney said the company is always trying to offer guests an array of tickets and experiences. To the company, and its most loyal fans, she said, the value of the experiences is worth the price.
“We are purposeful about creating more ticket and hotel price points than ever before to provide guests a variety of opportunities to visit our parks,” she said, adding that “a visit to a Disney theme park is a 10- to 16-hour experience with attractions, entertainment and more.”
Apps overload
For many guests, price isn’t the only hurdle. Visitors now have to navigate several new apps and tools if they want the best chance at getting on the most popular rides. In the past, they could get a free FastPass, which allowed them to go to the front of a line for a ride. In 2021, Disney replaced the FastPass with a digital feature called Genie+ that park goers had to pay for and that was supposed to make booking rides more efficient. Instead, it caused so much confusion that content creators started making videos that showed viewers how to “hack” the tool.
To get the best out of Genie+ guests had to buy the app early in the morning ( avid park-goers recommended doing so at 6 a.m.) and then, at 7 a.m., they would book rides for the day. They could only book more rides after they’d completed their first activity or two hours after making their first reservation. And they couldn’t choose what time they wanted to get on a ride — Genie+ would do it for them. Mr. Testa said all of this led to “Disney complexity fatigue.”
“ God forbid on your vacation, you want to go back to your hotel and take a nap,” Mr. Testa said. Others said having to always be on their phones took away from the experience of being on vacation.
Disney heard the complaints. In July, Genie+ became Lightning Lane Multi Pass, which makes it possible for people to reserve rides ahead of time, instead of on the day they are in the park. The new system, which starts at $30 a day, is an attempt at mixing Genie+ and FastPass, but only those willing to pay extra can use all the features. The Disney spokeswoman said that so far, guests are “very pleased” with Lightning Lane Multi Pass. Reviews on social media show that it may be too soon to tell. On Reddit, reviewers lamented the different prices for Lightning Lane passes, with one person saying she “despised the process” of booking in the new system so much she felt like throwing her phone.
Jeremy Sonkin, a Chicago-based content creator who makes videos about theme parks, was at Disney World on the first day the new system was available. He said the new app is less confusing than Genie+, but it doesn’t feel like an upgrade.
“The idea and thought behind trying to bring back the ‘Fast Pass plus’ system is correct, but it’s not a level playing field and I can see this causing just as much, if not more, frustration from guests,” he said.
Greg Antonelle, the managing director of MickeyTravels , a travel agency that focuses on booking Disney trips, said his company is having a great year, with travelers looking to experience new rides like Tiana’s Bayou Adventure , which replaced the old Splash Mountain ride. He said that complaining about Disney is par for the course.
“We’ve been in business for 13 years and we’ve heard complaints about cost for 13 years,” Mr. Antonelle said. “It’s nothing new.”
Follow New York Times Travel on Instagram and sign up for our weekly Travel Dispatch newsletter to get expert tips on traveling smarter and inspiration for your next vacation. Dreaming up a future getaway or just armchair traveling? Check out our 52 Places to Go in 2024 .
An earlier version of this article misstated the starting month of the Lightning Lane Multi Pass at Disney World. It started in July, not June.
How we handle corrections
Tariro Mzezewa, a former national correspondent at The Times, is a reporter who writes about culture and style. More about Tariro Mzezewa
Open Up Your World
Considering a trip, or just some armchair traveling here are some ideas..
52 Places: Why do we travel? For food, culture, adventure, natural beauty? Our 2024 list has all those elements, and more .
Lake Como, Italy: Stars like George Clooney frequent this scenic corner of northern Italy, but you might be surprised by how affordable it can be. Here’s an insider’s guide .
South of France: Horses, bulls and birds of all types live among the pink marshes of the Camargue, a rugged landscape shaped by the relentless push and pull of sea and river.
Disney Theme Parks: As Disney has raised the cost of tickets and hotel rooms at its theme parks, and added pricey, difficult-to-navigate tools, even its most loyal fans are asking themselves if they should rethink their vacations.
Helsinki, Finland: Explore the stunning architecture of the new central library, browse treasure-filled shops in the Design District, sweat in a wood-burning sauna, sip cocktails on a schooner and trek across islands in the surrounding archipelago.
Salzburg, Austria: The compact Austrian city of medieval alleys, majestic Alpine views and just 150,000 residents bursts to life in the summer .
Money blog: Aldi axes click and collect - as Tesco 'digital passport' plan revealed
Welcome to the Money blog, a hub of personal finance and consumer news/tips. This morning's posts include Aldi axing click and collect and Tesco launching digital passports. Leave a comment on any of the stories we're covering in the box below - we round them up every Saturday.
Thursday 15 August 2024 07:12, UK
- Aldi axes click and collect
- Tesco launching 'passports' for its clothing
- UK inflation rises for first time since December - analysis
Essential reads
- Is this the end of the British pub?
- What's gone wrong at Asda?
- Best of the Money blog - an archive of features
Tips and advice
- TV chef picks best cheap eats in London
- Savings Guide : Why you should now be checking T&Cs
- 'I cancelled swimming with weeks of notice - can they keep my money?'
Ask a question or make a comment
If you are a regular reader of the Money blog, you will have seen us cover the topic of security tags before.
We've noticed them on meat, cheese and baby milk , and now some chocolate treats are also getting the yellow security sticker treatment.
We spotted the tags below at an Asda in Twickenham earlier this week.
They were placed on a £2.50 box of Celebrations and Lindt Salted Caramel Lindors costing £5.
Also tagged were a £9.30 box of Maltesers Truffles, a £6.55 pack of Raffaello, a £10.50 tray of Ferrero Rocher and an £8.95 Thortons Classic box.
An Asda spokesperson confirmed to the Money team that "individual stores may tag specific products at their own discretion as a precautionary measure".
Earlier this year, it was revealed shoplifting had hit its highest level in 20 years.
The number of offences increased by 37% to 430,104 in the year ending 31 December 2023, compared with 2022, the latest Crime Survey for England and Wales found.
Several retailers have taken steps to curb the surge, including extra security and body-worn cameras.
The UK economy grew 0.6% over three months to the end of June, official figures show.
But there was no growth at all in June itself, the Office for National Statistics said.
Gross domestic product (GDP) - the measure of everything produced in the UK - expanded from April to June.
Follow our breaking story here ...
Aldi is axing its click and collect service within days, according to reports.
Customers will not be able to order groceries online from the supermarket beyond Sunday, said industry magazine The Grocer.
This follows Aldi's withdrawal of its limited home delivery service last year.
The decision was made to keep prices at their lowest possible, a spokesperson said.
"One of the ways we keep our prices low for customers is by running the most efficient supermarket business in Britain," they told The Grocer.
"As a result, we've made the decision to bring our click and collect service to an end so we can focus on doing just that."
Aldi launched the service in September 2020, eventually expanding to more than 200 stores.
Sky News has contacted Aldi for comment.
Tesco is launching "digital passports" across its clothing range ahead of new sustainability rules.
The digital product passports will allow customers to see information about items in the F&F range, including where its materials were sourced.
Tesco's Joe Little said the move represented "an important step forward, encouraging and promoting sustainable and circular practices".
The pilot is being launched with tech company Fabacus, which is run by the founder of Nobody's Child - a sustainable clothing brand that has previously used DPPs on three of its collections.
CEO and founder Andrew Xeni told the Money team that DPPs provided "a huge opportunity" for retailers to tell their story.
He said legislation for fashion using DPPs was expected to begin in 2027 so "practical implementation must start immediately".
What are DPPs and what do they do?
DPPs show key information about what the product is made from, its origin, history and how to dispose of it properly.
They capture data about the environmental impact of an item and are being introduced across the EU to improve sustainability.
Mr Xeni compared them to the nutritional information we see on food products, saying they will help people to make more informed decisions about what they are buying.
It's not clear what form Tesco will present them in, but when Nobody's Child launched theirs, they came as a QR code on the clothing's care label that could be scanned with a smartphone.
By 2030, a range of businesses are expected to be required to provide detailed information on the materials used in their products, and their environmental impact.
According to a provisional agreement from December, products with a high environmental impact will be prioritised as having to comply:
- Batteries
- Consumer electronics
- Electronic devices
- Construction products
"It's going to hold so many companies accountable," said Mr Xeni.
Last year, the government's European Scrutiny Committee raised concerns that the scheme could conflict with regulations in Northern Ireland because of the Windsor Framework - the post-Brexit legal agreement between the EU and the UK.
For Savings Guide this week, Savings Champion co-founder Anna Bowes looks at the best easy access accounts on the market.
Although variable-rate accounts like easy-access savings are likely to see rate cuts over the following days, weeks and months further to the base rate cut earlier this month, those who can't lock up their funds still need to seek the best rates.
In a rate-falling environment, it's really important to keep an eye on the interest you are earning and switch if you are no longer getting a competitive rate.
With easy access accounts this should be straightforward because, as the name suggests, you can get access to your money immediately.
But remember that a number of accounts may have restricted access, and if you have one of these, make sure you know what effect a further withdrawal will mean to your savings.
Most will simply allow you to close your account, even if you have made the maximum number of penalty-free withdrawals, but there are some that will not let you have any further access.
That's the case with the current top paying account - Principality Building Society Online Bonus Triple Access Issue 2.
If you have already made three withdrawals, you will be unable to close the account and have access to your money until the following calendar year.
It's important to read all the terms and conditions when opening a savings account, so that you earn the interest and have the access that you are expecting.
Further to this, there is still some £252bn sitting in current accounts earning no interest at all.
Although inflation has ticked up slightly in the 12 months to July 2024 to 2.2%, there are still plenty of accounts, including easy access, paying an interest rate that is beating the current rising cost of living.
A "major breakthrough" which could signal the end of national rail strikes has been made in the long-running pay row involving drivers, according to the Department for Transport (DfT).
The department said the train drivers' union ASLEF had agreed to recommend a new pay proposal to its members after a series of "positive" talks led by the government.
"The offer made to ASLEF is a 5% pay rise for 2022/23, 4.75% for 23/24, and 4.5% for 24/25," a spokesperson for the DfT said.
"The offer will now be put to ASLEF members in a referendum."
During the two-year pay dispute, drivers have taken 18 days of strike action, as well as refusing to work non-contractual overtime.
Mars is buying the food company Kellanova in a deal worth nearly $30bn (£23.3bn).
The deal will see the business, which already owns several brands such as M&M's, Snickers and Skittles, take control of a huge portfolio of products, including Pringles, Pop Tarts and Cheez-Its.
Kellanova was created when the Kellogg Co split into three companies in 2022.
Based in Chicago, it had net sales of more than $13bn (£10bn) last year and has around 23,000 employees.
Mars Inc said it will pay $83.50 dollars (£65.02) per share in cash, putting the total value of the transaction at £35.9bn (£27.9bn).
The deal is expected to close in the first half of next year.
"The Kellanova brands significantly expand our snacking platform, allowing us to even more effectively meet consumer needs and drive profitable business growth," Andrew Clarke, global president of Mars Snacking, said in a statement.
Adverts for nutrition brands Zoe and Huel featuring a Dragons' Den star have been banned for failing to disclose their commercial relationship with the celebrity.
Steven Bartlett is an investor in Zoe and a director at Huel, but the the Advertising Standards Authority (ASA) found ads seen on Facebook in February "omitted material information" about their links to him.
Starbucks has ousted its chief executive Laxman Narasimhan after less than two years at the helm.
The news comes after pressure for management change from hedge fund Elliott Management.
Read more...
Primark is trying to make headway in US markets with an advertising campaign across the pond.
Hoping "That's so Primark" will catch on, the retailer is introducing its budget style via two 30-second videos.
The company aims to open 60 stores in the US by 2026.
John Lewis is looking to cut 153 jobs as part of a staff shake-up across its stores.
The high street giant claims the proposals are designed to improve customer service, ensuring workers are "in the right place, doing the right tasks at the right time".
It is hoping the job cuts will be through voluntary redundancy and natural attrition - which covers people leaving through retirement, resignations or moving job.
Staffing changes will also see currently separate roles for serving front and back of house combined.
John Lewis is also investing £5m in digital headsets for store workers to communicate better with one another - in a bid to improve service.
The changes, which were announced to staff yesterday, follow a similar staffing overhaul at sister business Waitrose.
A spokesman for John Lewis said: "We're seeking to make sure partners are in the right place at the right time to help customers.
"We're also removing unnecessary tasks and introducing new technology to make their roles easier.
"We carried out similar changes in Waitrose earlier this year, with customer and partner feedback increasing significantly since.
"It's since been ranked the number one supermarket for customer satisfaction."
Coca-Cola is launching an Oreo-flavoured drink in collaboration with the biscuit manufacturer.
The limited edition, zero-sugar drink will be released from September in a black and white can containing what Coca-Cola describe as "flavourful hints inspired by Oreo cookies".
At the same time, Oreo will release a Coca-Cola flavoured biscuit.
Eugenia Zalis, global head of marketing for Oreo-maker Mondelez International, said she "cannot wait to see the reaction" from customers - but they're already coming in before the products have even hit the shelves.
Multiple X users were quick to deploy the Jurassic Park meme inspired by Jeff Goldblum's character, Ian Malcolm: "Your scientists were so preoccupied with whether or not they could, they never stopped to think if they should".
Another added: "I will happily eat Oreos while drinking a Coke Zero, but I don't want either of these things."
Others were more enthusiastic, simply writing: "Need."
Ms Zalis was confident about the collaboration, saying: "We have truly upped the ante."
The beverage will be available at major retailers and Pizza Express, Popeyes and Slim Chickens, Coca-Cola said.
Be the first to get Breaking News
Install the Sky News app for free

IMAGES
COMMENTS
The average length of a domestic business trip in the U.S. is three days. The average length for an international trip is 5-6 days. Overall, these numbers seem to slowly decline over time, with the old average (2016) for international business trips being just over six days.
On the average business trip, companies spend $1,217 for international round-trip tickets and $470 on domestic business tickets. (JTB Business Travel) For every trip, US businesses spend nearly $950 per traveler who travels inside the US, while the average cost for an international business trip is $2,600 per person. ...
3. In comparison, the average cost of a domestic business trip in the U.S. in 2019 was $990, while international business trips averaged $2,525 , showing us that business travel costs are on the rise. [2] 4. On average, companies spend 17%-27% of their total travel budget on airfare. [3] 5.
The average daily cost of business travel in the US is $325 per day. (Small Biz Genius, 2021) Businesses spend roughly $1,425 for every employee they send on a business trip. (Fyle, 2020) Companies spend $111.7 billion on business travel every year. This is an average of $1,286 per work trip.
Understanding the kind of travel your business requires is essential to create an accurate budget. With that said, you can use some figures to guide "average" expectations. For a three-day domestic trip (the average length of a business trip), a realistic target might be $1,389.09 or more, depending on your destination city and whether you ...
Average business travel cost in the United States from 4th quarter 2018 to 4th quarter 2021 (in U.S. dollars per day) Premium Statistic Highest-priced U.S. business travel destinations Q4 2023
The cost of the average American business trip is $1293. While domestic trips average at $990 per itinerary, for international ventures, the number rises to $2525 (Runzheimer and Expert Market). Domestic flights within the U.S are increasing in cost, with roundtrips averaging around $330 compared to $235 at the start of 2022
By 2028, the business travel market is predicted to grow by 188%. Due to the Covid-19 pandemic, the loss in global business travel spending reached over $700 billion in 2020. Accommodation makes up 34% of the average business trip cost, while airfare makes up 27%, meals 20% and car rental 19%.
• Business travel demand has remained relatively consistent over the last four quarters, however, the average business traveler in 2023 Q1 expects to travel more often. Business travelers anticipate taking 2.6 trips per month over the coming six months -compared to 2.0 in the prior survey.
2020. -54%. In 2021, the global business travel expenditure dropped to $754B from $1.4T in 2019. Business travel spending in the US decreased by nearly 60% in 2020, plummeting from 2019's $313B to $122B. Worldwide, business travel shrank by almost half, from $1.5T to $700B, causing over 2M people to lose their jobs.
A. Runzheimer report from 2019. revealed that the average US business trip cost $1293. This report showed that business trip expenses had been increasing, and that the most expensive states for business travel were Hawaii, Massachusetts, and California. Of course, costs differ significantly between international travel and domestic travel.
In 2021, the global business travel market was worth $689.7B, and it's expected to grow to $2.1T by 2031, with a 9.5% CAGR between 2022 and 2031. Global business tourism spending reached an estimated $1,357B in 2023, and it's forecast to reach $1,782B in 2027. It's estimated that US travelers will take 447M domestic business trips in 2024.
The average business travel hotel guest is male (63%), aged 35-54 (50%), employed in a professional or managerial position (56%) and earning an average yearly household income of $127,000. As much as 78% travel alone, with the large majority of business travelers making reservations (95%). According to USA Today, The Hampton Inn and Suites was ...
In the U.S., the average daily cost of business travel is $325 per day. (Business Travel News) Roughly $1,425 is spent by businesses for every employee they send on a business trip. (Fyle) Money for lodging (34%), airfare (27%), meals (20%), and car rentals (19%) is what the average business travel budget consists of. (Travel Pulse)
The youngest and oldest groups of adult business travelers, 18 to 29 and 60+ years old, represent about 16% and 10% of business trips, respectively. Business trips are generally made by those with household incomes that exceed the national average, which is about $47,500, according to the Bureau of Labor Statistics.
Average business travel cost in the United States from 4th quarter 2018 to 4th quarter 2021 (in U.S. dollars per day) [Graph], Business Travel News, March 31, 2022. [Online].
The cost of business travel, from hotels to airfare, is set to rise through 2023 as demand returns more than two years after the Covid pandemic began, according to an industry report published ...
Expected average number of trips per month by business tourists in the United States as of September 2022, by type [Graph], Tourism Economics, & US Travel Association, October 12, 2022. [Online].
Pleo have a good guide on how to choose a company credit card. . 2. Pay with personal cards and submit expense claims. For many small to medium size businesses, this is the simpler option. Asking employees to pay business expenses from their personal account is pretty standard practice.
The classic business-class road warrior has been keeping it in park. Though corporate business travel is expecting to surpass pre-COVID-19-levels on a nominal basis this year, the Financial Times ...
Erica Lamberg is a personal finance and travel writer based in suburban Philadelphia. She is a regular contributor to USA Today and her writing credits include NBC News, U.S. News & World Report ...
As both travel and confidence have rebounded in recent years, the average number of nights spent away per trip has been steadily creeping up and now sits at 4.6 versus 4.5 (2023), 4.3 (2022), and ...
The average business trip lasts 3.8 days (SavvySleeper). Pre-pandemic, 57% of businesses had travel policies allowing employees to add leisure time to their business trips (Forbes) In 2021, 37% of corporate travelers from North America extended their business trips to do some sightseeing and other leisure activities
Average domestic business trip cost in the United States from 3rd quarter of 2013 to 1st quarter of 2020 (in U.S. dollars) [Graph], Travel Leaders Group, May 14, 2020. [Online].
The Atlantic hurricane season is about to ramp up with a barrage of tropical storms and hurricanes, and AccuWeather forecasters warn the season could approach record-setting levels.
NEW YORK, Aug 8 (Reuters) - Travel companies including Airbnb (ABNB.O), opens new tab and Marriott International (MAR.O), opens new tab are forecasting a slowdown in leisure travel as U.S ...
The data they've collected in recent years shows that the cost of a Disney World trip, on average, has gone up almost 25 percent since 2019. ... "We've been in business for 13 years and we ...
Mars is buying the food company Kellanova in a deal worth nearly $30bn (£23.3bn). The deal will see the business, which already owns several brands such as M&M's, Snickers and Skittles, take ...