- Editor's Choice: Back-to-School Tech Gifts
- Get These 12 Student Discounts!

How to Activate the iPhone Debug Console or Web Inspector
Use Safari's web developer tools to study problematic websites
:max_bytes(150000):strip_icc():format(webp)/ScottOrgera-f7aca23cc84a4ea9a3f9e2ebd93bd690.jpg)
- Saint Mary-of-the-Woods College
- Switching from Android
What to Know
- Activate Web Inspector on iOS: Go to Settings > Safari > Advanced and move the Web Inspector toggle switch to the On position.
- Use Web Inspector on macOS: Connect your iOS device to a Mac and choose the URL to inspect from the Develop menu.
If you run into a bug or another issue with a website on Safari mobile, use the Web Inspector tool to investigate. This article explains how to use the Safari console for iPhone to debug errors with the help of your Mac computer. Instructions apply to iPhones with iOS 14, iOS 12, or iOS 11, and well as Macs with macOS Big Sur (11.0), macOS Catalina (10.15), or macOS Mojave (10.14).
Activate Web Inspector on Your iPhone or Other iOS Device
The Web Inspector is disabled by default since most iPhone users have no use for it. However, if you're a developer or you're curious, you can activate it in a few short steps. Here's how:
Open the iPhone Settings menu.
On an iPhone with an early version of iOS, access the Debug Console through Settings > Safari > Developer > Debug Console . When Safari on the iPhone detects CSS, HTML, and JavaScript errors, details of each display in the debugger.
Scroll down and tap Safari to open the screen that contains everything related to the Safari web browser on your iPhone, iPad, or iPod touch.
Scroll to the bottom of the page and select Advanced .
Move the Web Inspector toggle switch to the On position.
Connect Your iOS Device to Safari on a Mac
To use the Web Inspector, connect your iPhone or another iOS device to a Mac that has the Safari web browser and enable the Develop menu .
With Safari open, select Safari from the menu bar and choose Preferences .
Select the Advanced tab.
Select the Show Develop menu in menu bar check box and close the settings window.
From the Safari menu bar, select Develop and choose the name of your attached iOS device, then select the URL that appears under Safari to open the debug console for that site.
After you connect your device, use your Mac to inspect the website you want to debug and have it open in the Safari mobile browser.
What Is Web Inspector?
Web developers use Web Inspector to modify, debug, and optimize websites on Macs and iOS devices. With Web Inspector open, developers can inspect the resources on a web page. The Web Inspector window contains editable HTML and notes regarding the styles and layers of the web page in a separate panel.
Before iOS 6, the iPhone Safari web browser had a built-in Debug Console that developers used to find web page defects. Recent versions of iOS use Web Inspector instead.
With Safari 9 and OS X Mavericks (10.9), Apple introduced Responsive Design Mode in Web Inspector. Developers use this built-in simulator to preview how web pages scale to different screen sizes, resolutions, and orientations.
To set up Web Inspector on your iPad, open your iPad's Settings and select Safari > Advanced , then turn Web Inspector On . Connect the iPad to a Mac computer, then open Safari on the Mac and select Safari > Preferences > Advanced , then turn on Show Develop menu in menu bar .
You cannot just connect your iPhone to a Windows PC and start using Web Inspector through Chrome like you can with a Mac. Installing package manager software can provide you a sort of workaround, but it's not recommended unless you're familiar with the package management app you intend to use.
Get the Latest Tech News Delivered Every Day
- How to Screen Record on iPhone 13
- How to Turn Off Do Not Disturb on iPhone 14
- How to Use Voice Control on iPhone and iPod Touch
- How to Turn Off the Flashlight on an iPhone 12
- How to Turn Off SOS on an iPhone 15
- How to Set up and Use Focus Mode on iPhone and Apple Watch
- How to Fix Could Not Activate Cellular Data Network Error
- How to Activate Incognito Mode in Chrome for iPhone, iPad, and iPod Touch
- The 10 Best iPhone Hacks & Tips for 2024
- How to Fix it When Optimized Battery Charging is Not Working on iPhone 13
- How to Unlock iCloud-Locked iPhones
- How to Turn Off SOS on an iPhone 14
- Do These 12 Things First When You Get a New iPhone
- How to Get Your iPhone to Announce Calls
- iPhone Focus Mode: What It Is and How to Use It
- Where to Buy an iPhone
How to Inspect Element on Safari for Mac
This is how you Inspect Element on Safari for macOS

When you know how to Inspect Element on Safari for Mac, you can delve into the HTML and CSS code of a web page, to see how it's really functioning behind the scenes or to make changes to how the site looks or functions (these are only temporary and the changes will be discarded after you close your browser).
If you're on a website you've built, you can use Inspect Element to debug issues with a page's front end.
Chrome and Firefox users will be used to simply right clicking on a page element and then selecting Inspect Element. However, with Safari the Inspect Element feature is not enabled by default, so you may be scratching your head about where to find it, especially if you're unfamiliar with Apple's browser. To enable Inspect Element, you first have to switch on Safari's Developer Menu.
If you aren't sure how, fear not, as this guide will show you exactly how to Inspect Element on Safari. All you need to do is read on.
- In Safari, click Safari in the tool bar
- Click Settings and head to Advanced
- Check Show Develop menu in menu bar
- On a webpage, right click an element
- Click Inspect Element
Read on to see illustrated instructions for each step.
1. Open Safari's settings

With the browser open, click Safari in the top left, then click Settings .
2. Under Advanced, enable the Develop menu
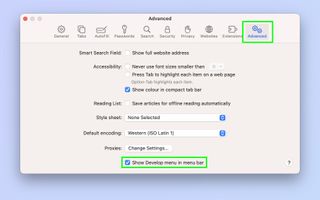
Click the Advanced tab , then check Show Develop menu in the menu bar . You can now close the Settings window .
3. Right click and select Inspect Element
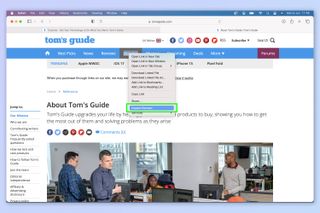
Right click a page element and select Inspect Element from the menu.
4. Inspect the page code
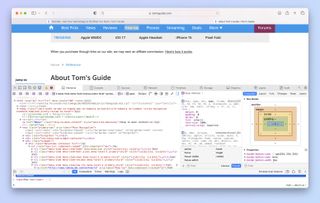
You can now inspect the page code in HTML and CSS. Have fun!
If you'd like to learn more ways to get the most out of your Mac, we have lots of helpful tutorials just like this one. Find out how to enable macOS beta updates , so you can see and test the new features coming to your Mac in upcoming OS releases. I
f your Mac is behaving a little sluggishly, learn how to clear the cache on Mac , as this may help speed things back up. If you're sick of screenshots sitting on your desktop and spoiling your clean background, discover how to change the screenshot save location on Mac . Messy desktop? Learn how to use desktop stacks on Mac .
Sign up to get the BEST of Tom's Guide direct to your inbox.
Get instant access to breaking news, the hottest reviews, great deals and helpful tips.
Peter is Reviews Editor at Tom's Guide. As a writer, he covers topics including tech, photography, gaming, hardware, motoring and food & drink. Outside of work, he's an avid photographer, specialising in architectural and portrait photography. When he's not snapping away on his beloved Fujifilm camera, he can usually be found telling everyone about his greyhounds, riding his motorcycle, squeezing as many FPS as possible out of PC games, and perfecting his espresso shots.
Google Chrome just got 3 AI features that look like a game changer — here’s what’s new
Chrome could get some important energy saving upgrades — what we know
I review Macs for a living, and I install these 5 apps first on every MacBook
Most Popular
- 2 Home Depot’s Labor Day sale is live — 23 deals I’d shop now on grills, patio furniture and more
- 3 7 things you should know before buying a dehumidifier
- 4 How to make homemade bug repellent — 3 spray recipes to keep your yard pest-free
- 5 Is this the world's smartest coffee maker? I tried the Terra Kaffe TK-02
How-To Geek
How to turn on the develop menu in safari on mac.

Your changes have been saved
Email is sent
Email has already been sent
Please verify your email address.
You’ve reached your account maximum for followed topics.
Chrome Is Top Dog, but Firefox Is Still My Favorite Browser
The history of imageboards and how they still influence the web, why you shouldn't sign in with google or facebook, quick links, how to enable the develop menu in safari on mac, how to view page source in safari on mac.
When you right-click on any web page in Safari on Mac, it doesn't reveal the Show Page Source and Inspect Element buttons. To see these, you need to enable the Develop menu---we'll show you how to do that.
Once you've enabled the Develop menu, right-clicking a blank space on any website will reveal the Inspect Element and Show Page Source buttons. These allow you to take a look at the source code of any website, which is useful for things like downloading images from websites and debugging code or finding out what it looks like behind any site (for website designers).
You can easily turn on the Develop menu in Safari by following a couple of steps. Open Safari on your Mac and click the "Safari" button in the menu bar.
Next, select "Preferences." Alternatively, you can use the keyboard shortcut Command+, (comma). This will also open up Safari preferences.
Go to the "Advanced" tab.
Check the box for "Show Develop Menu in Menu Bar."
Now the Develop menu will appear between Bookmarks and Window at the top.
Apart from being able to view the page source, this will allow you to access developer-focused features, such as disabling JavaScript on any website.
Once you've enabled the Develop menu, there are a couple of ways to view the page source in Safari.
Open any website in Safari and right-click the blank space on the page. Now, select "Show Page Source." You can also get to this menu by using the keyboard shortcut Option+Command+u.
If you're looking for images or other media elements from any web page, Safari makes it easy to find these. In the left-hand pane, you will see various folders such as Images, Fonts, etc. Click the "Images" folder to quickly find the photos that you need.
After selecting an image, you can view its details easily by opening up the details sidebar. The button to open this is located at the top-right of the console, just below the gear icon. You can also open this with the shortcut Option+Command+0.
Click "Resource" at the top of the details sidebar to view details, such as the size of the image and its full URL.
You can change the position of the page source console easily, too. There are two buttons at the top-left of this console, right next to the X button. Click the rectangle icon to move the console to a different side within the browser window.
If you'd like to open the page source console in a separate window, you can click the two-rectangles icon. This will detach the console and open it in a separate window.
To check out the code for any specific element on the page, you can right-click that element and select "Inspect Element." This will take you directly to the code for the element that you selected.
Whenever you're done looking at the code, click the X button to close the page source console and return to browsing on Safari. You can also check out how to view a website's page source in Google Chrome here.
Related: How to View the HTML Source in Google Chrome
- Web Browsers
Safari User Guide
- Get started
- Go to a website
- Bookmark webpages to revisit
- See your favorite websites
- Use tabs for webpages
- Import bookmarks and passwords
- Pay with Apple Pay
- Autofill credit card info
- View links from friends
- Keep a Reading List
- Hide ads when reading
- Translate a webpage
- Download items from the web
- Add passes to Wallet
- Save part or all of a webpage
- Print or create a PDF of a webpage
- Interact with text in a picture
- Change your homepage
- Customize a start page
- Create a profile
- Block pop-ups
- Make Safari your default web browser
- Hide your email address
- Manage cookies
- Clear your browsing history
- Browse privately
- Prevent cross-site tracking
- See who tried to track you
- Change Safari settings
- Keyboard and other shortcuts
Use the developer tools in the Develop menu in Safari on Mac
If you’re a web developer, the Safari Develop menu provides tools you can use to make sure your website works well with all standards-based web browsers.
If you don’t see the Develop menu in the menu bar , choose Safari > Settings, click Advanced, then select “Show features for web developers.”
Open Safari for me
How to use Safari Web Inspector on Mac, iPad, and iPhone
If you’re a web developer, then you likely already know about Safari’s Web Inspector. But if you’re just starting to use Safari for development or have just begun your Web Development career, this guide will show you the basics for getting started with the Safari Web Inspector on iOS and Mac.
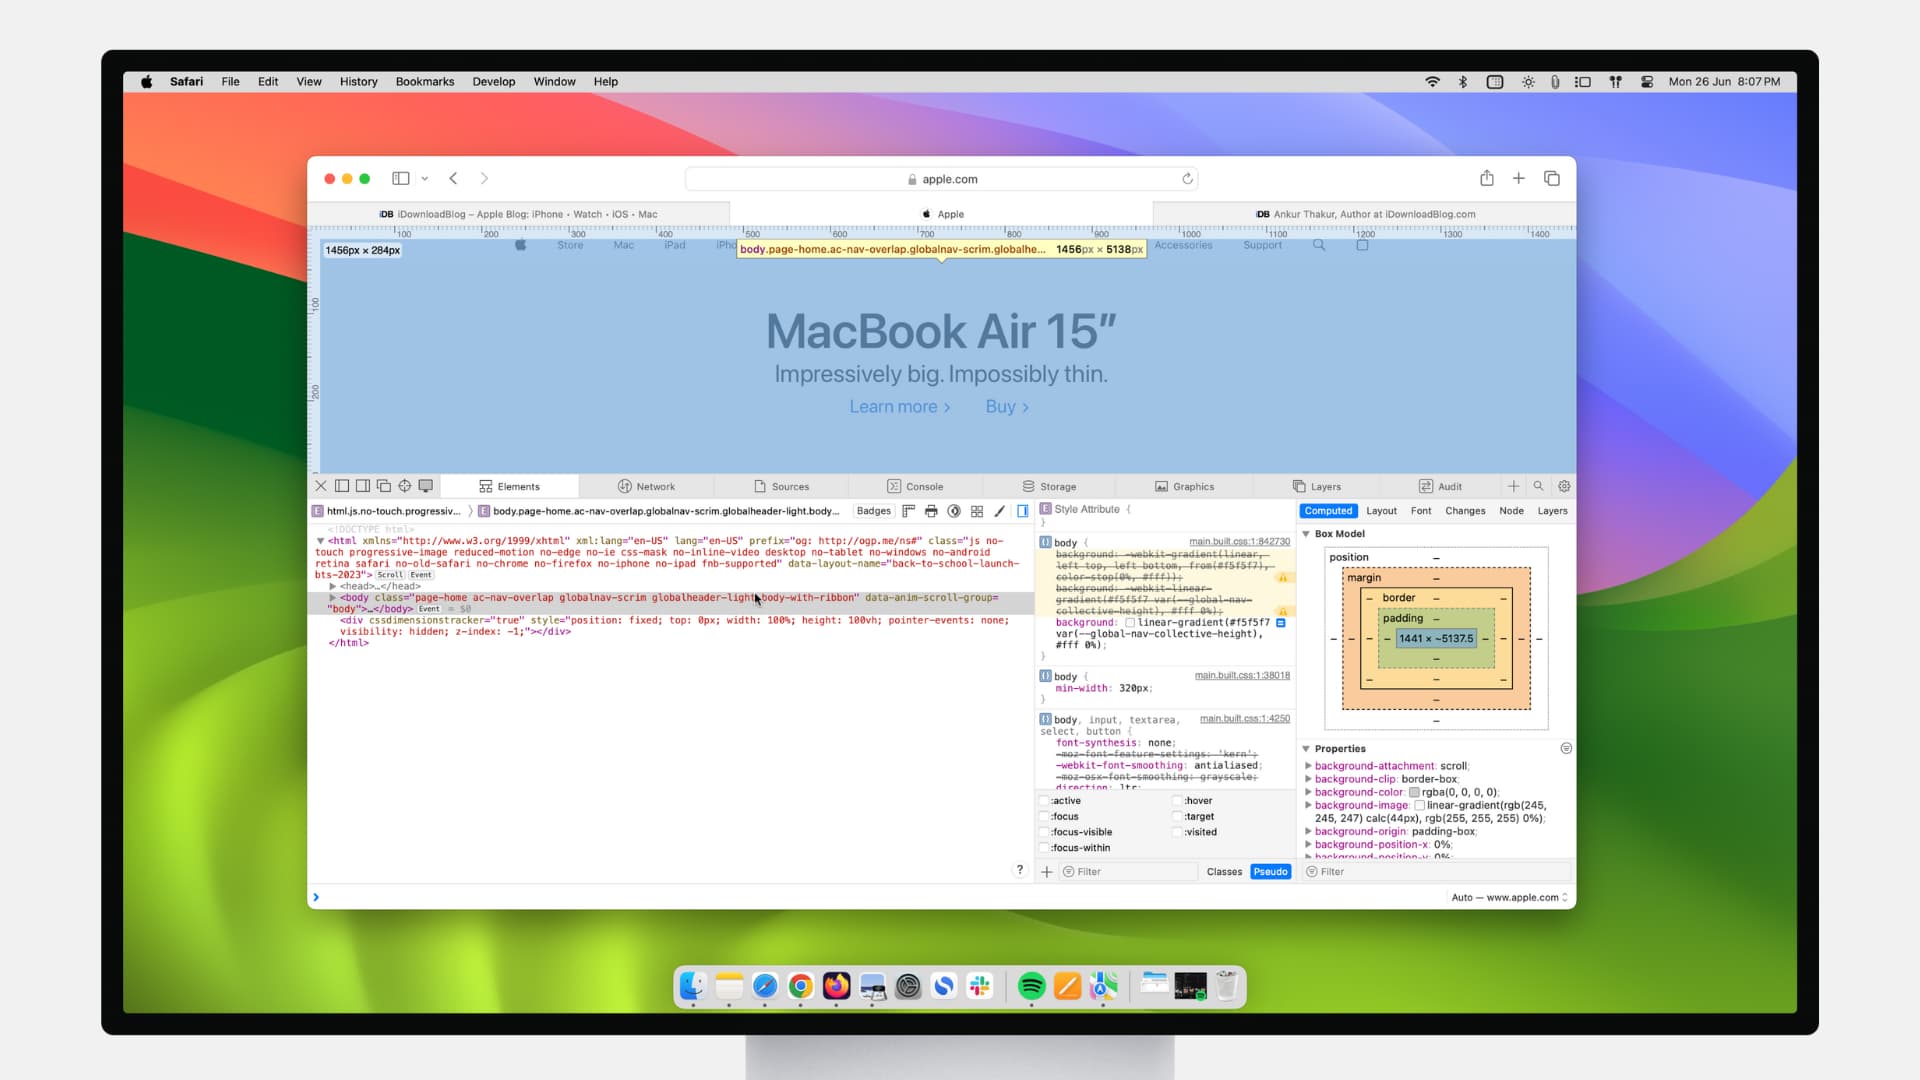
What is the Safari Web Inspector?
For those not yet familiar with the tool, you can use the Safari Web Inspector for help with your web development. It allows you to review page elements, make changes, troubleshoot problems, and review page performance. Apple sums it up with:
Web Inspector is the primary web development tool in Safari. Web Inspector allows you to inspect, tweak, debug, and analyze the performance of your web content in a Safari tab.
Enable and open Safari Web Inspector
You can use the Safari Web Inspector for development on your iPhone, iPad, or Mac. Here’s how to enable and open it on iOS and macOS so you’re ready to use it when you need it.
If you’re going to use the Web Inspector frequently, whether for iOS or Mac, you might as well add the Develop tab to your menu bar so you can access it easily.
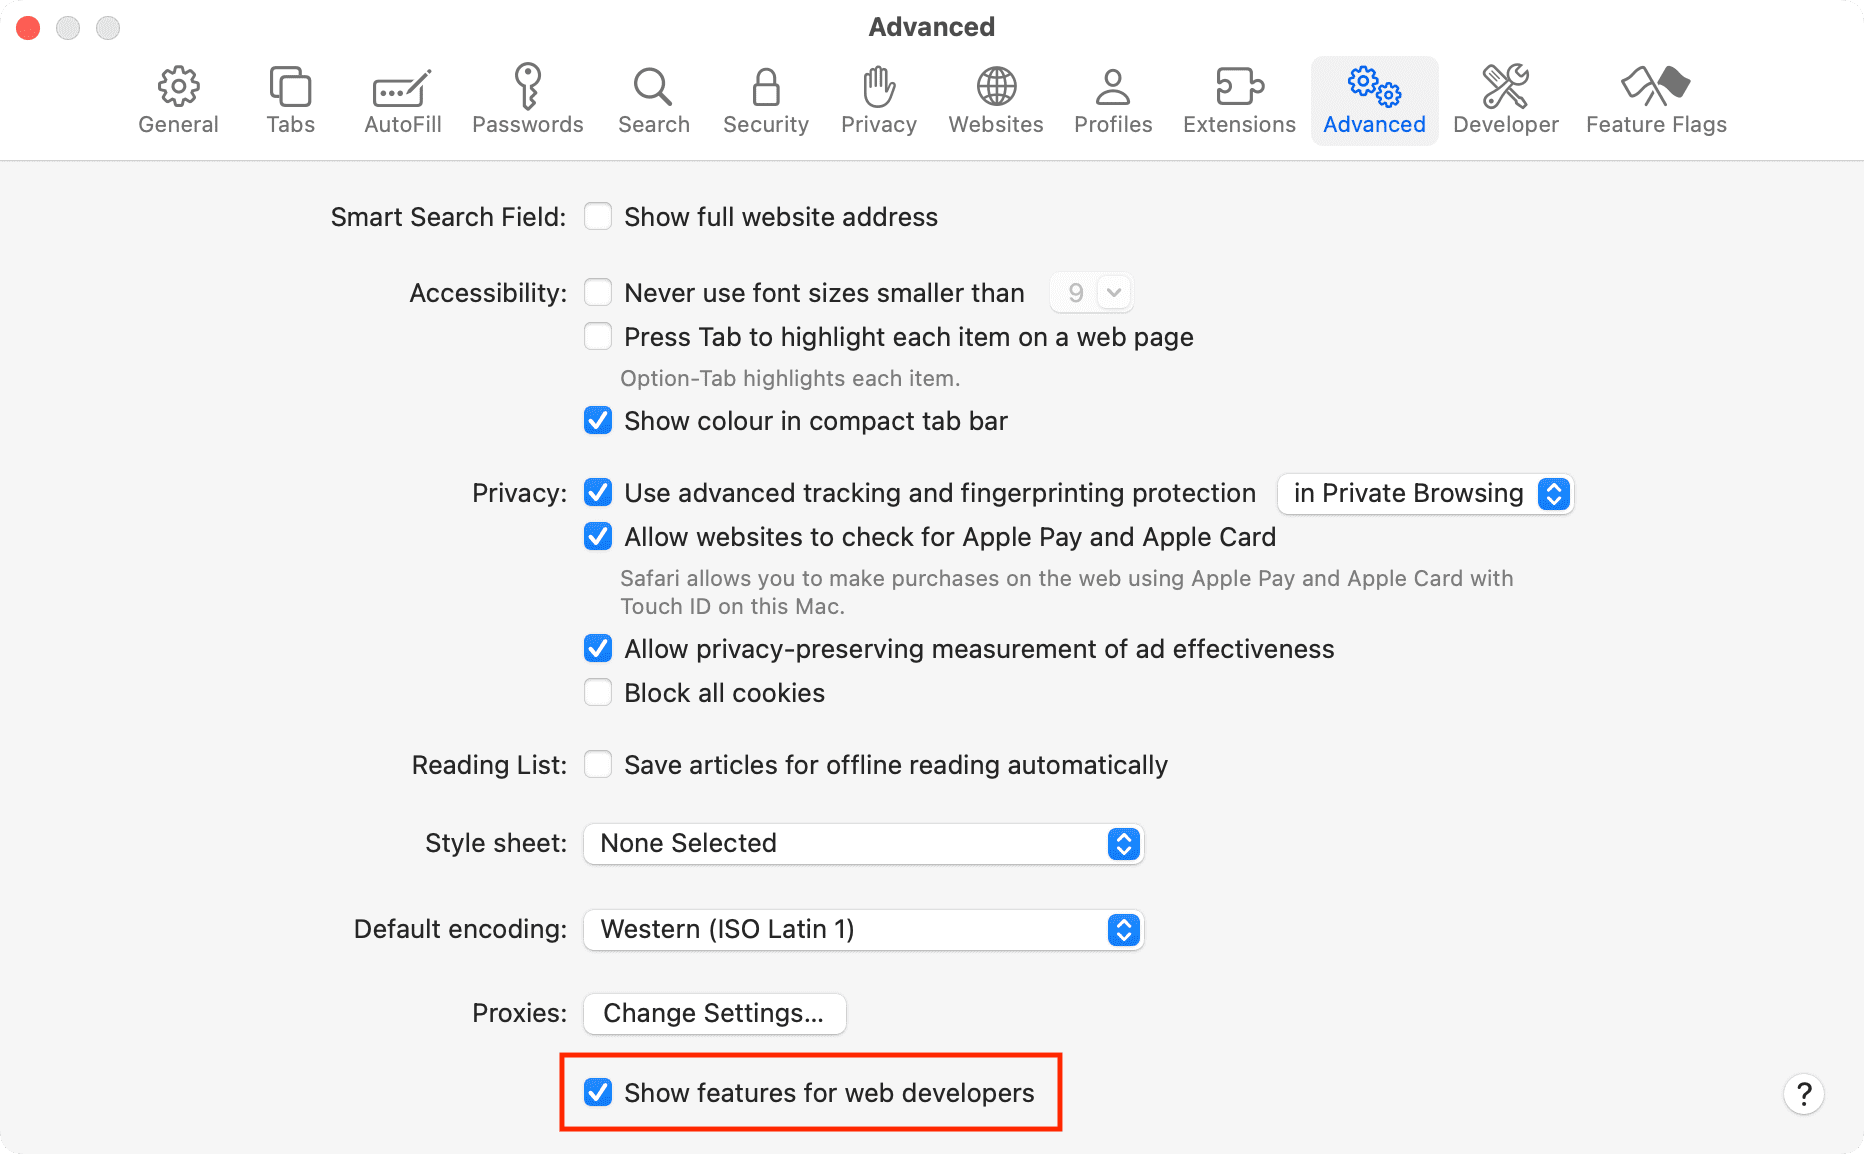
- Open Safari on your computer and click Safari > Settings or Preferences from the menu bar.
- Choose the Advanced tab.
- Check the box at the bottom for “ Show features for web developers ” or Show Develop menu in menu bar .
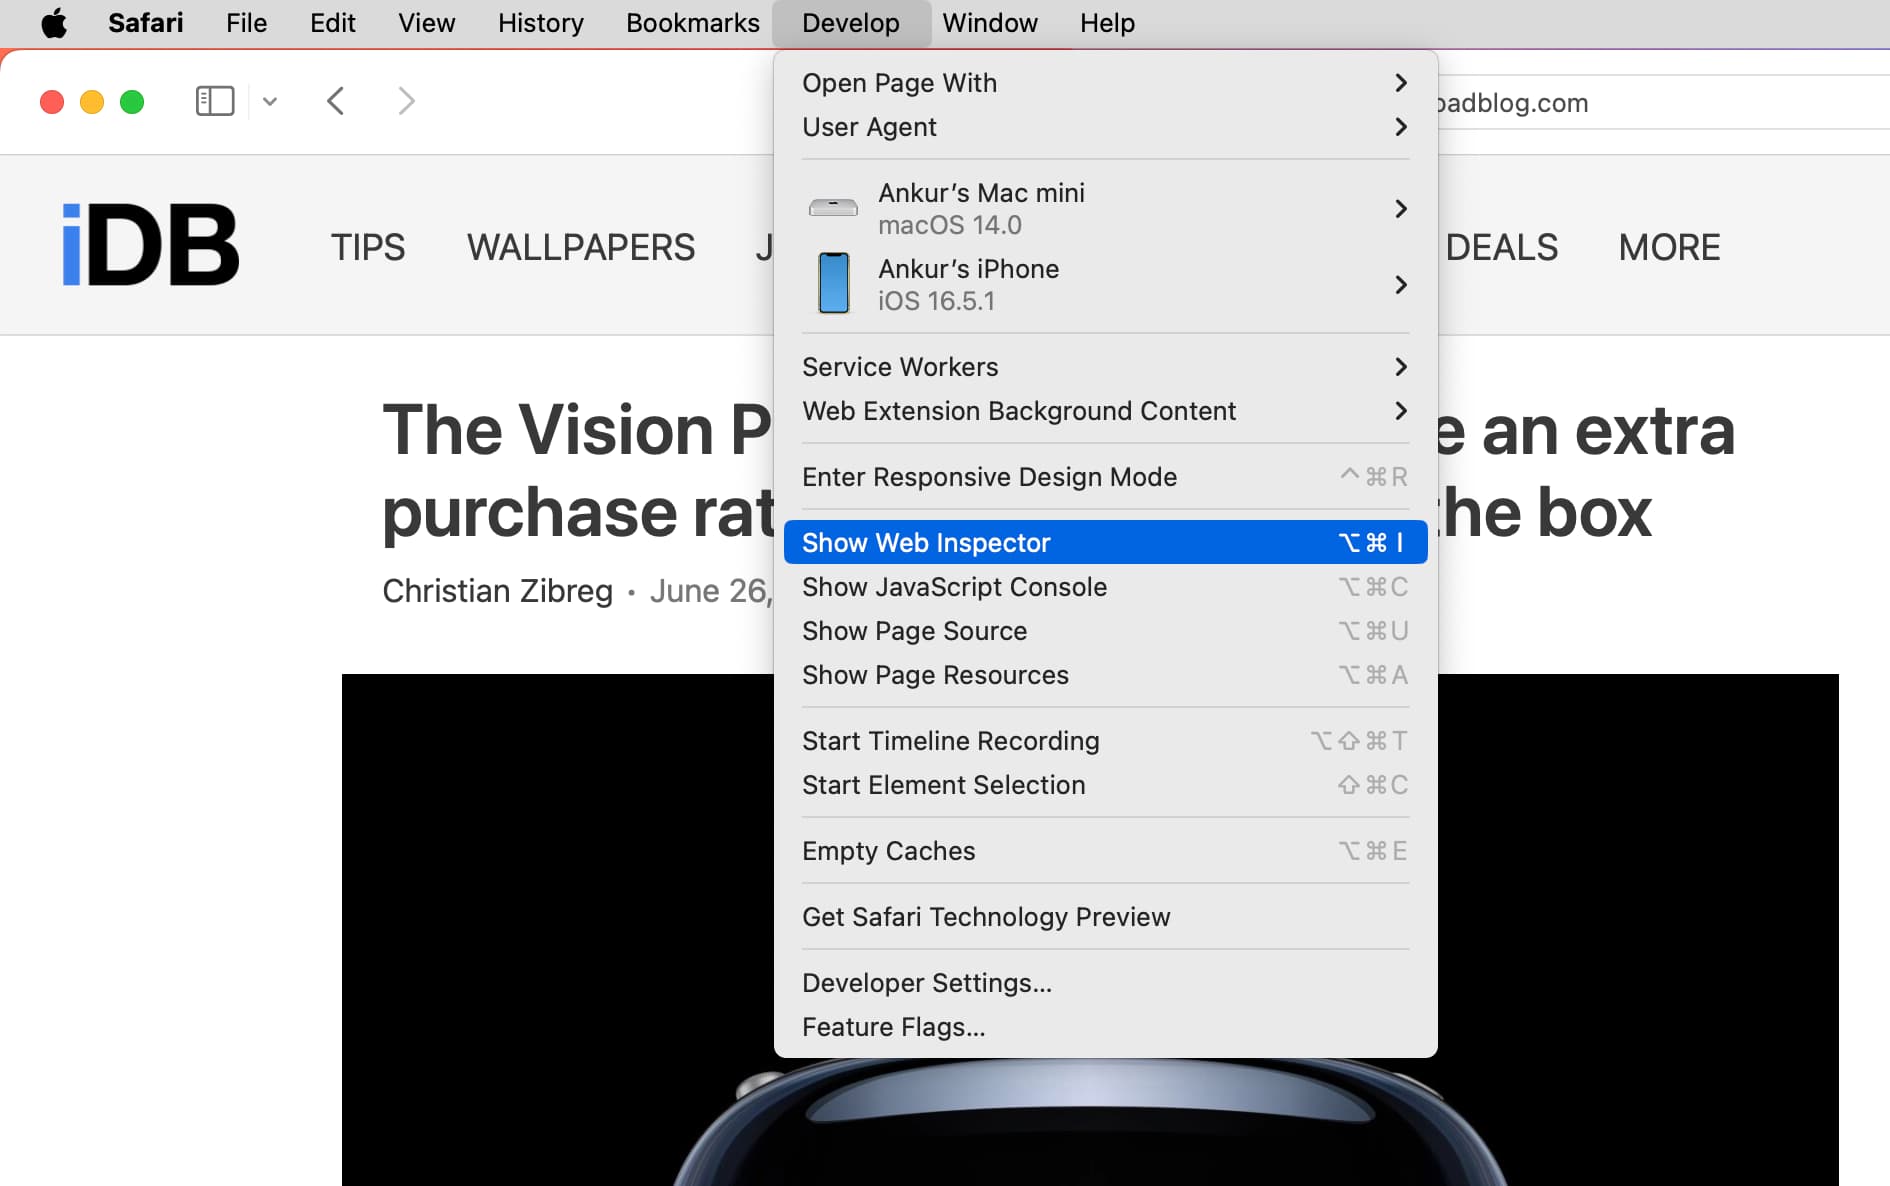
Now when you want to enable the Web Inspector, click Develop > Show Web Inspector from your menu bar.
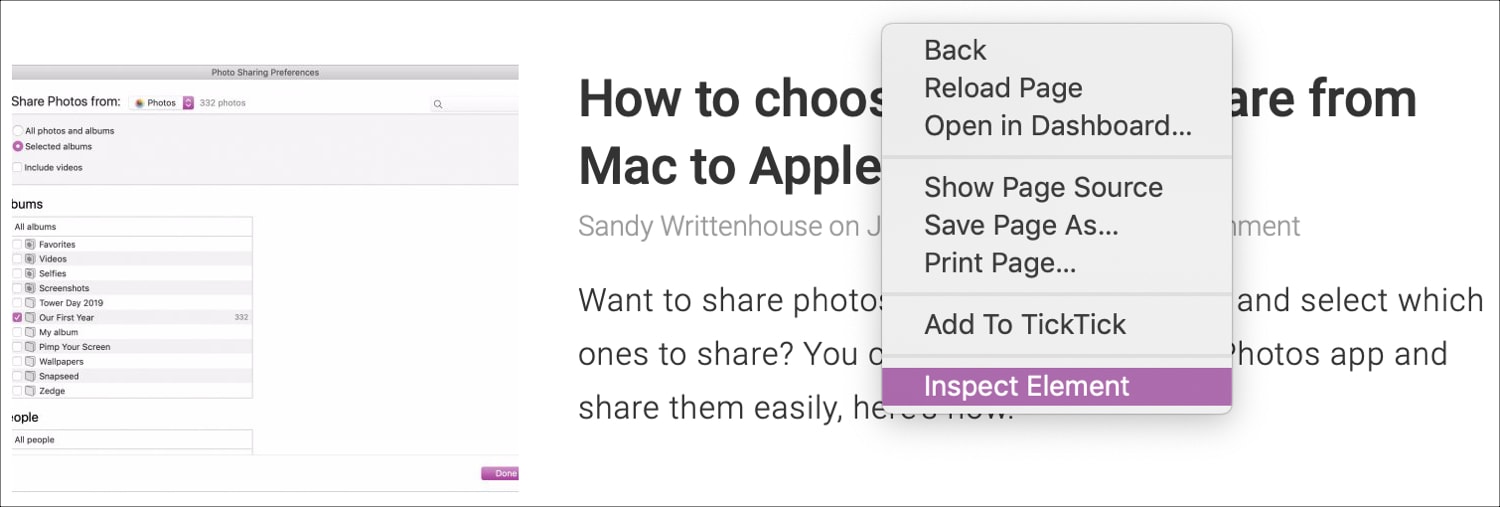
If you prefer to forgo adding the Develop button to your menu bar, you can access the Web Inspector on Mac with a shortcut. Navigate to the page you want to inspect, right-click on it, and pick Inspect Element from the context menu.
Just keep in mind that if you plan to use Web Inspector for Safari on your iOS device, you’ll need the Develop button in the menu bar on your Mac.
For iPhone and iPad
To use the Web Inspector for iOS on your Mac, grab your USB cable and connect your iPhone or iPad to your computer. Then, follow these steps to enable the tool:
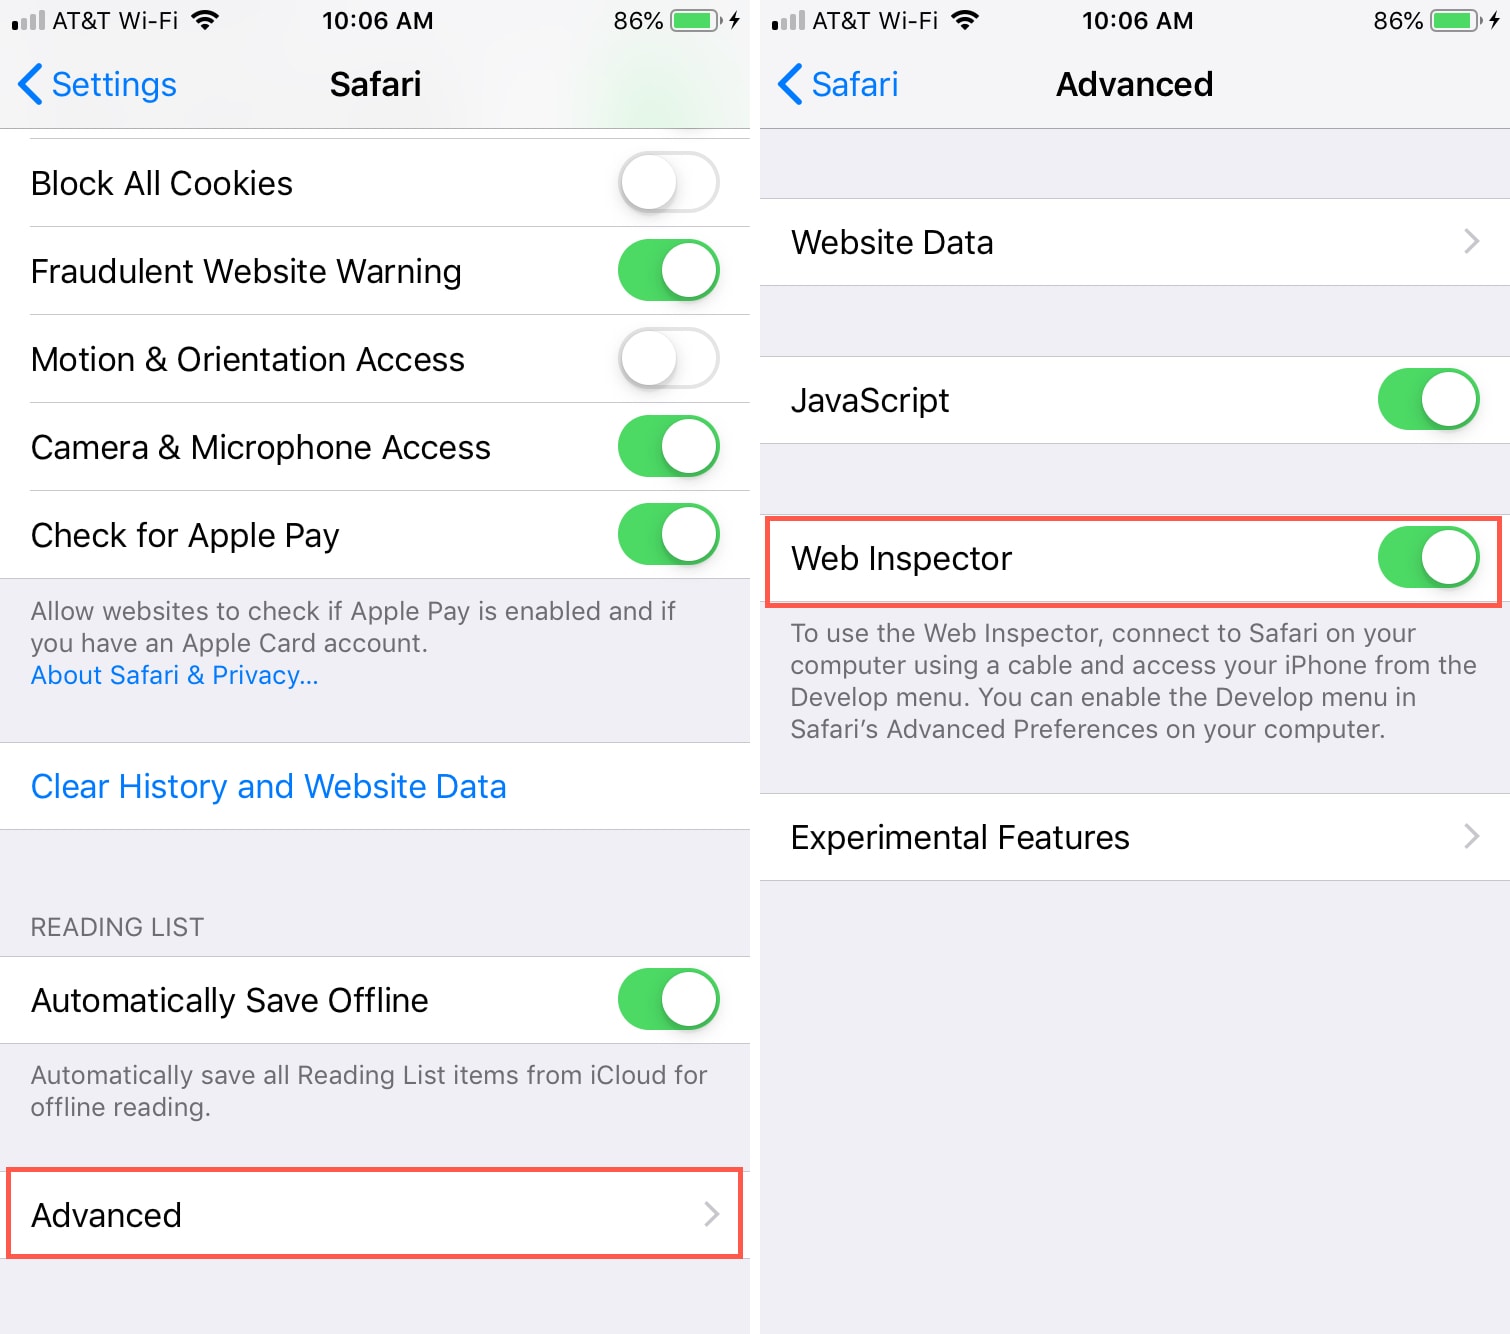
- Open the Settings app on your iPhone or iPad and tap Safari .
- Scroll to the bottom and tap Advanced .
- Enable the toggle for Web Inspector .
Next, make sure Safari is open on your iOS device and your Mac. After that, follow these steps:
1) Click Develop from the Safari menu bar on Mac, and you’ll see your iPhone or iPad listed here.
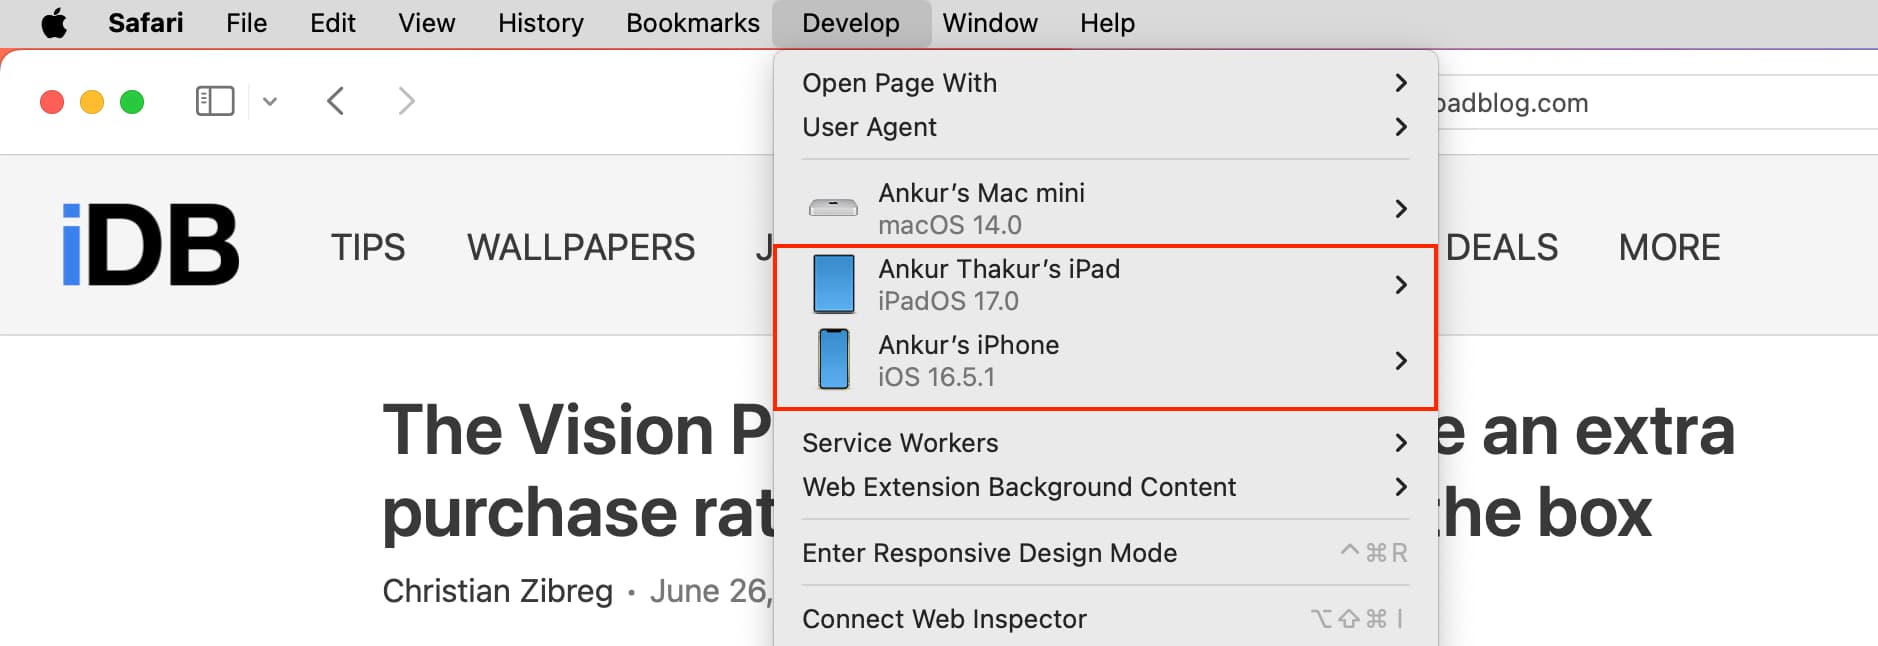
2) Mouse over the device, and you’ll then see the websites open in Safari on your mobile device.
3) Select the one you want, and the Web Inspector will pop open in a new window for you to use.

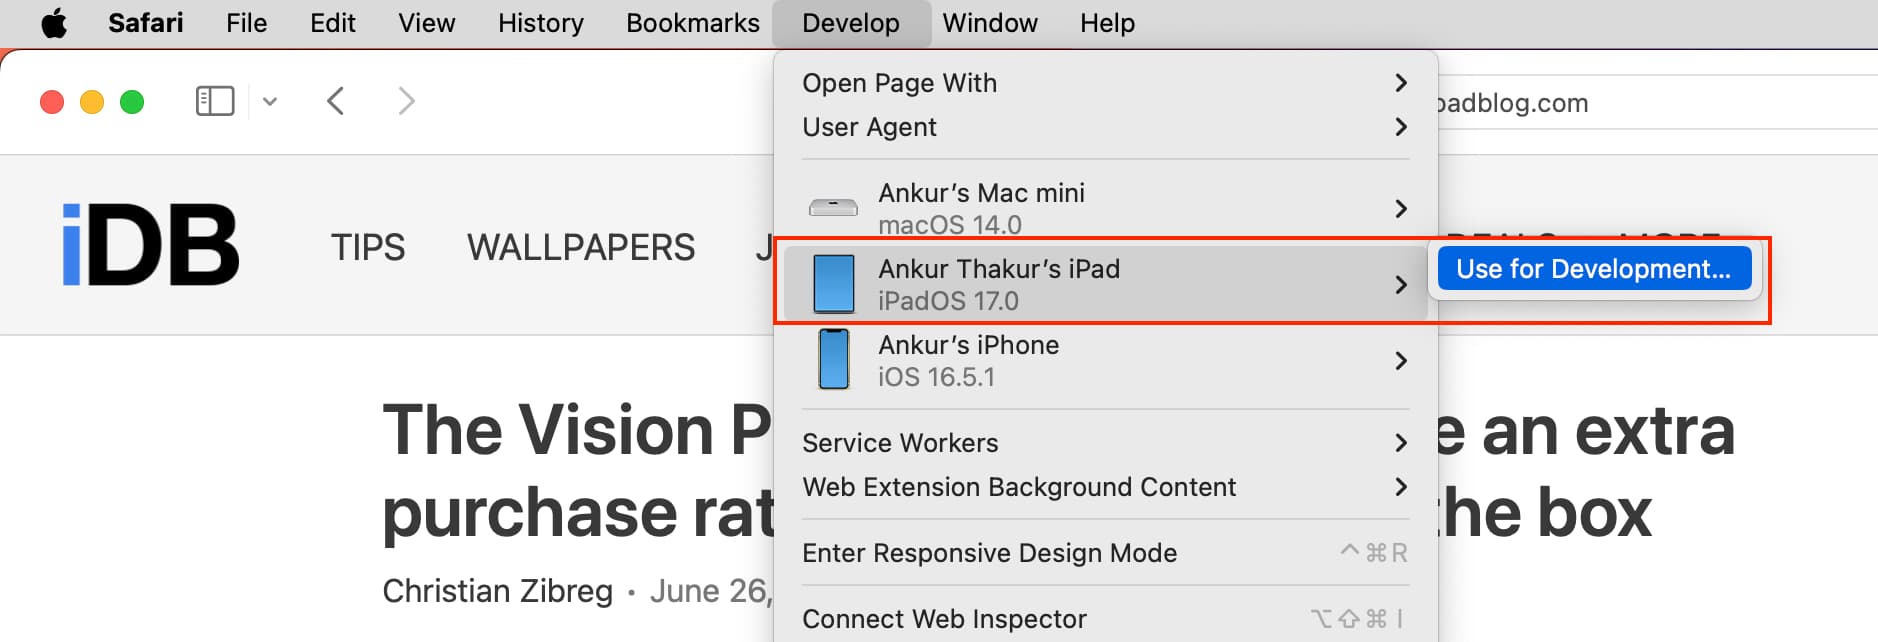
Note: If this is the first time you’re using your iPhone or iPad for this work, take your mouse cursor over that iPhone or iPad and click Use for Development . Next, tap Trust on your iPhone or iPad and enter the device passcode. Now, this iOS or iPadOS device is ready to be used for web inspection. If it still shows a correction error, simply unplug the USB cable and plug it in again.
Position the Safari Web Inspector
If you’re using the Web Inspector for iOS, it will remain in its own floating window.
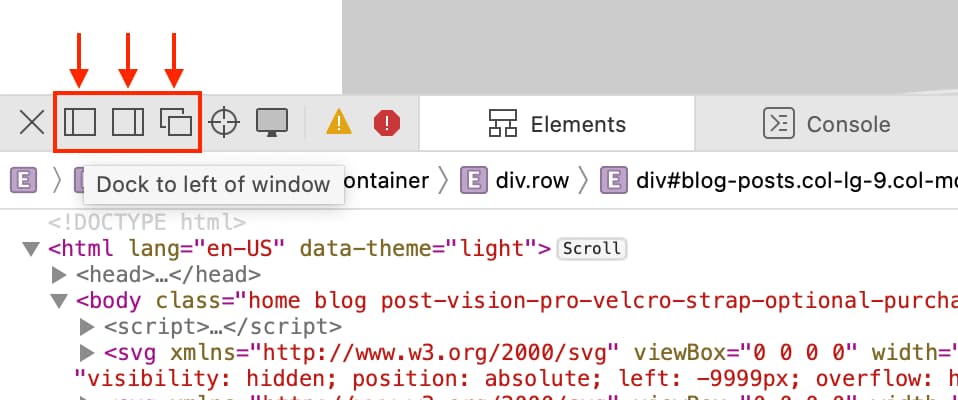
If you’re using it for Safari on your Mac, you can change its position. By default, Web Inspector displays at the bottom of your Safari window. To detach it and place it in a separate window or dock it to the left or right side of Safari, select one of the buttons from the top left of the Inspector window.
Get to know the Web Inspector
The Safari Web Inspector has a handy toolbar and tabs with some options that you can adjust to fit your needs.
Web Inspector toolbar
- “X” to close the Inspector
- Positioning buttons
- Reload button
- Download web archive button
- Activity viewer (resource count, resource size, load time, logs, errors, warnings)
- Element selector button
Web Inspector tabs
You can use all tabs or just a few. You can right-click or hold Control and click the tabs and then check and uncheck those you want to see. Rearrange the tabs by holding and dragging them to their new positions. And all the way to the right of the tabs bar, you’ll see a Settings button. This lets you adjust settings for tabs, indents, source maps, zoom, and more.

- Elements : Current state of the page’s Document Object Model
- Network : Resources loaded by the current page
- Debugger : View the JavaScript execution, variables, and control flow
- Resources : Resources being used by the current page’s content
- Timelines : A view of what the page’s content is doing
- Storage : State that is available to the page’s content
- Canvas : Contexts created from CSS
- Console : Shows logged messages and lets you evaluate JavaScript code
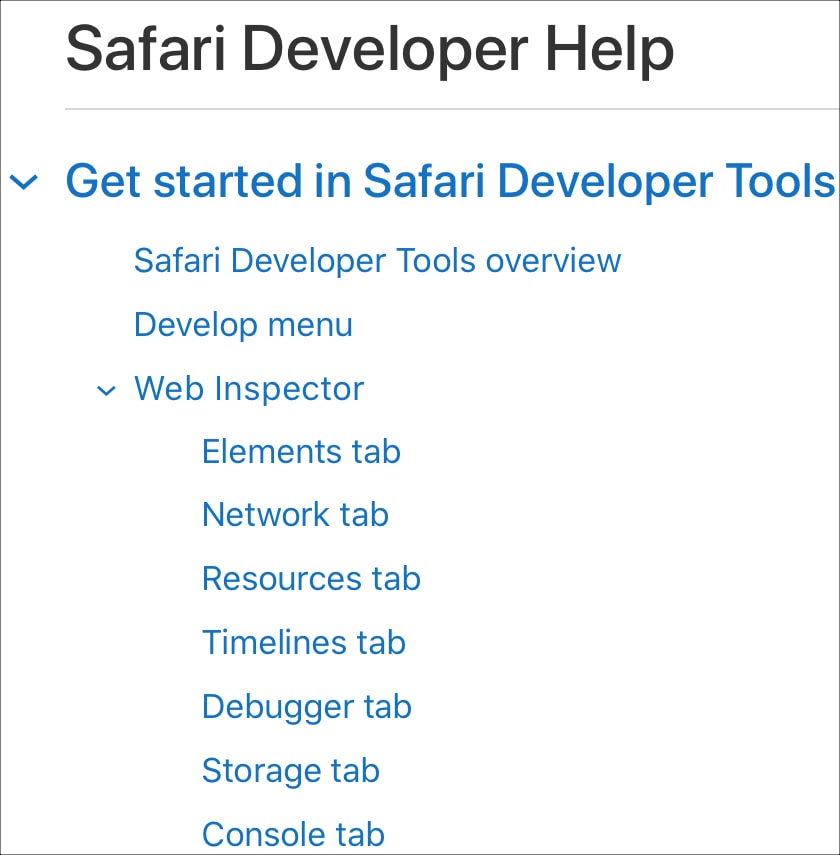
For in-depth help on a specific tab, you can head to the Apple Developer Support site . Select Table of Contents > Get started in Safari Developer Tools > Web Inspector .
Good luck with your inspection!
Hopefully, this guide will help you as you start working with the Safari Web Inspector for your iPhone, iPad, or Mac web development.
If you currently use the Web Inspector and have tips and tricks you’d like to share with others who are just starting, please feel free to comment below!
Check out next: How to view the source code of a webpage in Safari
Freelance iOS, macOS, Apple Watch, and Apple TV Developer
Web inspector on ios devices and simulators.
Want to keep up to date? Sign up to my free newsletter which will give you exclusive updates on all of my projects along with early access to future apps.
Over the past few weeks I’ve worked on a number of projects that have necessitated me working with HTML and JavaScript be that via Safari on iOS, an SFSafariViewController, or in an embedded WKWebView. In all of these cases, I’ve needed to dive into the DOM to see what styles are being applied to certain elements or dig into a JavaScript Console to work out why some code isn’t working. On desktop, this is trivial as Safari has a Web Inspector panel built in similar to other browsers. It turns out it is also trivial on mobile as the exact same tool can be used with both iOS simulators and physical devices.
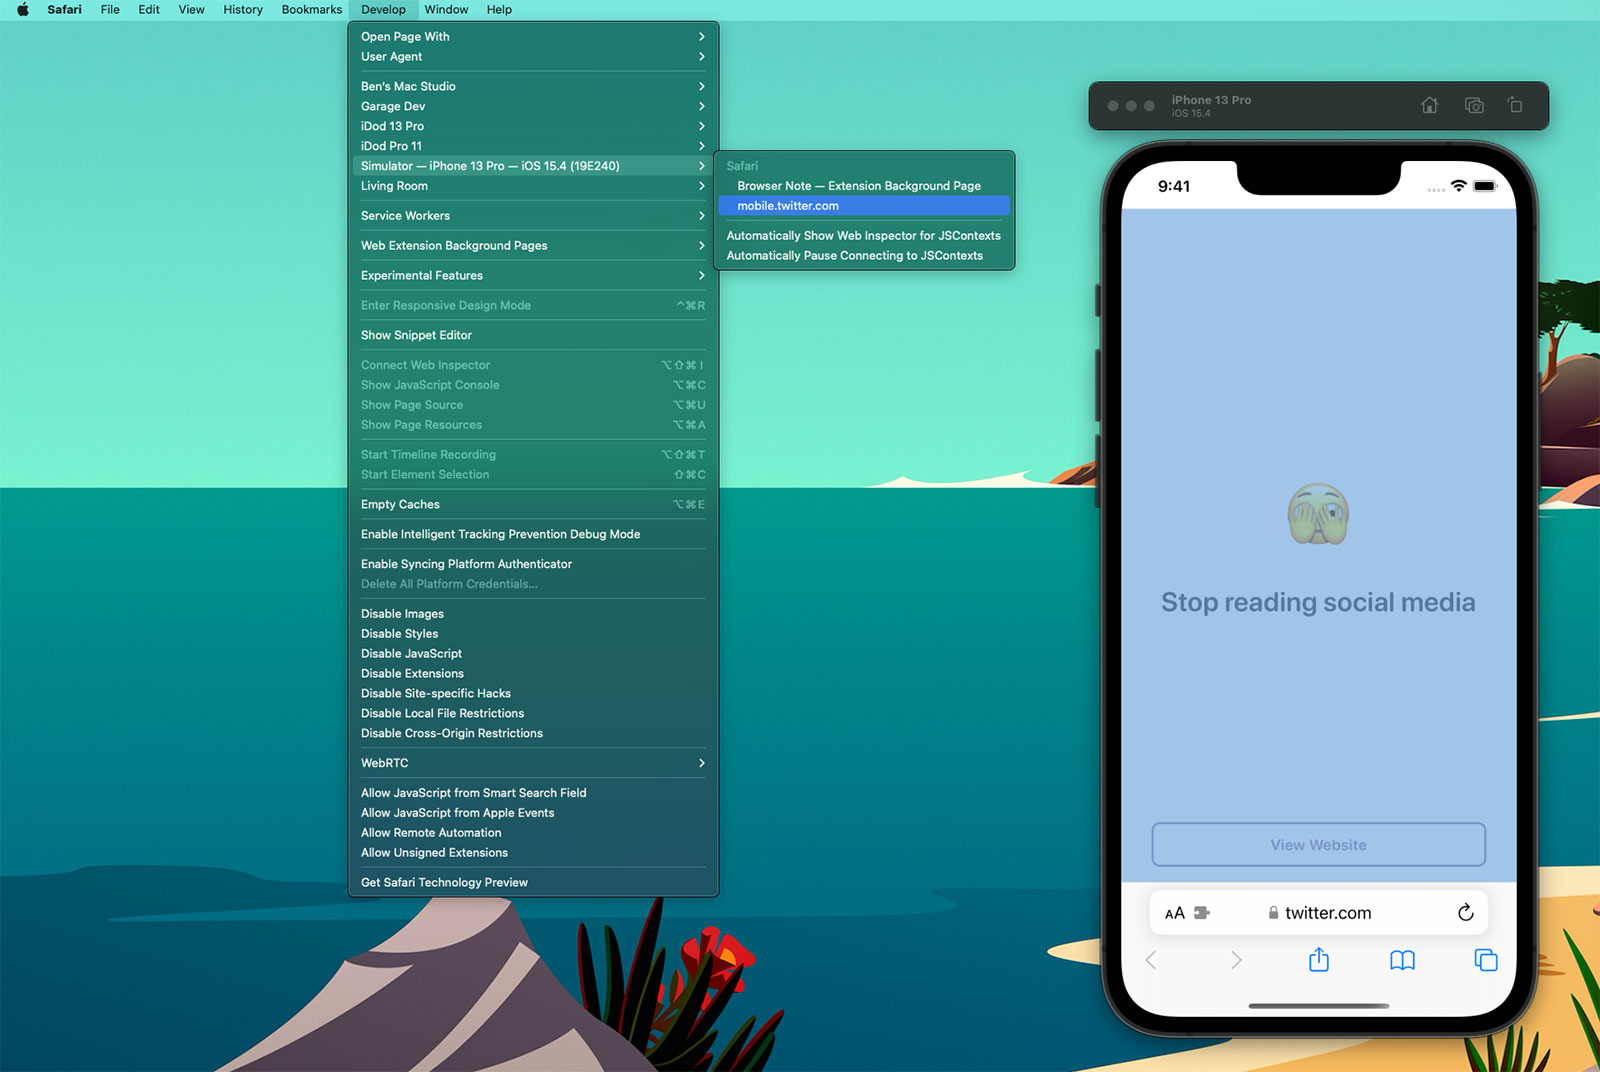
If you select the ‘Develop’ tab from the menu bar of Safari on macOS, you’ll see a list of all of your connected devices and actively running simulators 1 . Drilling into this will then show all of the active web instances you can interact with; notice how the content within Safari has highlighted blue within the Simulator as I’ve moused over the twitter.com web instance above. When you click, a web inspector panel is then produced which allows you to make all the usual interrogations and changes you can within desktop Safari such as interacting with the console or changing CSS values of elements to see how they would look in realtime.
Here’s an example using a WKWebView within one of my client projects, Yabla Spanish :
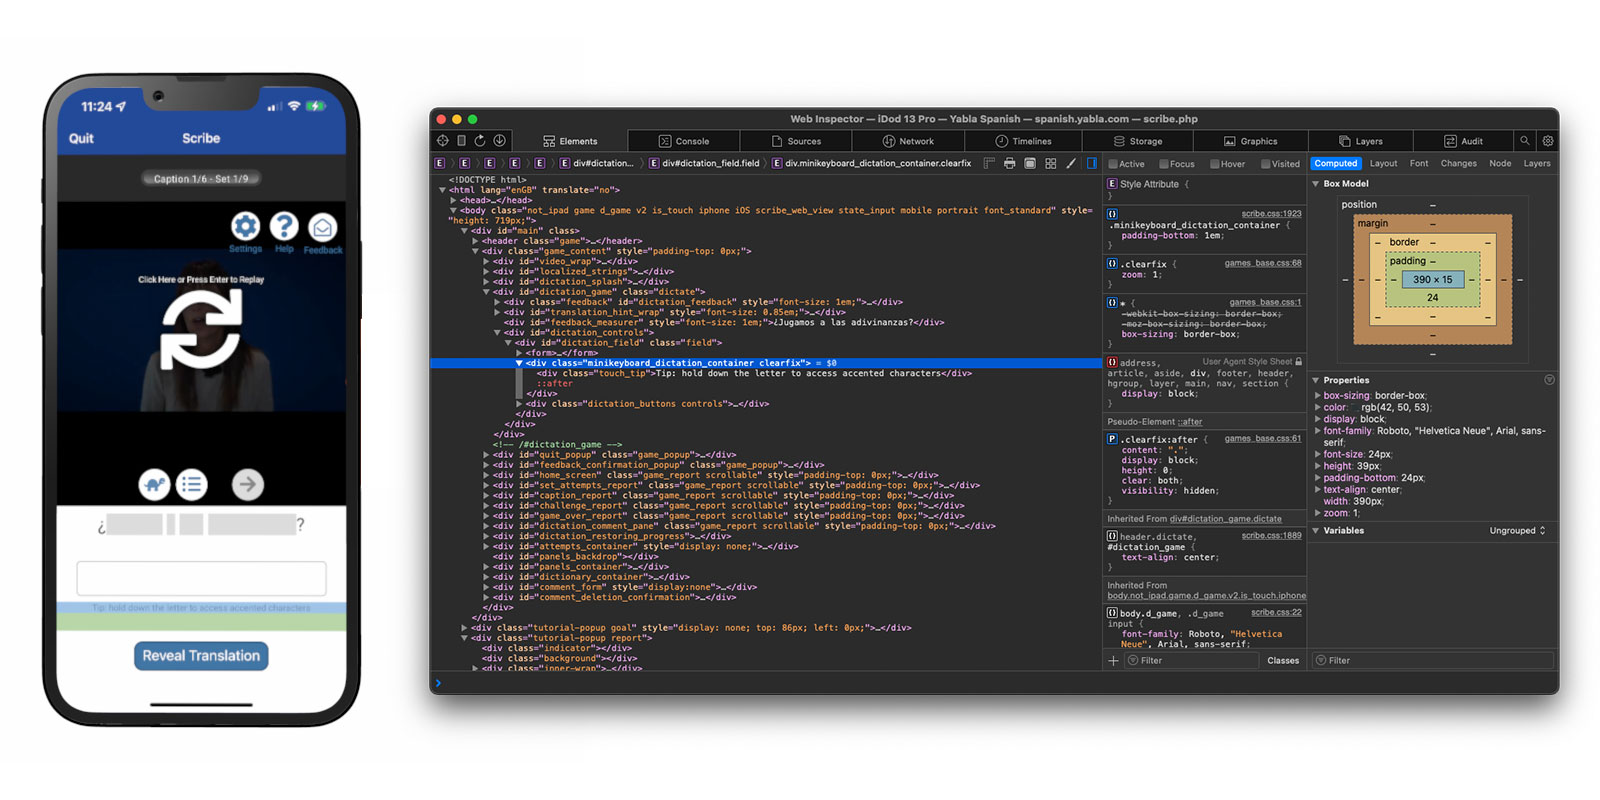
Discovering that simulators and devices could be interacted with in this way has been a huge timesaver for me. Whilst developing Browser Note , I was constantly needing to tweak CSS values and investigate the current state of the DOM as websites have various tricks to try and make ads or cookie notices appear on top of all content (and the note needed to be on top at all times - you should totally take a look at Browser Note whilst you’re here). In doing this, I was then able to put this knowledge to use on no less than 3 client projects in the past month; this validates my theory that by working on your own side projects you can improve your efficiency when it comes to work projects.
There are a few caveats to be aware of when using the Web Inspector with an iOS device or simulator:
- If you want to use this on an actual device you’ll first need to enable the Web Inspector on iOS. To do this, go to the Settings app and then Safari > Advanced and toggle the Web Inspector on.
- Whilst the Web Inspector can interrogate WKWebView, it can only do this for apps you are running via Xcode. You cannot look at the WKWebView of apps you did not create nor of your own apps from TestFlight / the App Store. However, you can inspect debug builds installed via Xcode even if the debugger is not active (i.e. you build to the device then quit Xcode).
- Conversely, you can use the Web Inspector with any SFSafariViewController even if it is not in your own app.
- Whilst it is still possible to submit apps that use UIWebView, the web inspector will not work with them; it needs to be WKWebView .
- This also works for AppKit, SwiftUI, and Catalyst apps on macOS.
I use an “iDod” naming prefix for all of my devices; a throwback pun to my first Apple product, the iPod. ↩︎
- PRO Courses Guides New Tech Help Pro Expert Videos About wikiHow Pro Upgrade Sign In
- EDIT Edit this Article
- EXPLORE Tech Help Pro About Us Random Article Quizzes Request a New Article Community Dashboard This Or That Game Happiness Hub Popular Categories Arts and Entertainment Artwork Books Movies Computers and Electronics Computers Phone Skills Technology Hacks Health Men's Health Mental Health Women's Health Relationships Dating Love Relationship Issues Hobbies and Crafts Crafts Drawing Games Education & Communication Communication Skills Personal Development Studying Personal Care and Style Fashion Hair Care Personal Hygiene Youth Personal Care School Stuff Dating All Categories Arts and Entertainment Finance and Business Home and Garden Relationship Quizzes Cars & Other Vehicles Food and Entertaining Personal Care and Style Sports and Fitness Computers and Electronics Health Pets and Animals Travel Education & Communication Hobbies and Crafts Philosophy and Religion Work World Family Life Holidays and Traditions Relationships Youth
- Browse Articles
- Learn Something New
- Quizzes Hot
- Happiness Hub
- This Or That Game
- Train Your Brain
- Explore More
- Support wikiHow
- About wikiHow
- Log in / Sign up
- Computers and Electronics
- File Manipulation
4 Easy Ways to Inspect Element on an iPhone
Last Updated: August 1, 2024 Fact Checked
- Safari Developer Tools
- Web Inspector
- JavaScript Bookmark
- Edit Webpage Shortcut
This article was reviewed by Luigi Oppido and by wikiHow staff writer, Nicole Levine, MFA . Luigi Oppido is the Owner and Operator of Pleasure Point Computers in Santa Cruz, California. Luigi has over 25 years of experience in general computer repair, data recovery, virus removal, and upgrades. He is also the host of the Computer Man Show! broadcasted on KSQD covering central California for over two years. There are 8 references cited in this article, which can be found at the bottom of the page. This article has been fact-checked, ensuring the accuracy of any cited facts and confirming the authority of its sources. This article has been viewed 52,971 times.
Need to debug a website on your iPhone but can't find "Inspect Element?" While this common browser feature isn't built into Safari on your iPhone, there are still ways you can inspect website elements without paying for an app. The official way is to use Safari Developer Tools, which requires you to connect your iPhone to a Mac. If you're not near a computer, you can install a free app called Web Inspector, or create a JavaScript bookmark (which also works on Chrome). Or, if you're not debugging a web app and just want to change the way a website looks, you can use an iPhone shortcut called Edit Webpage.
Things You Should Know
- Use Safari Developer Tools to inspect elements by connecting your iPhone to your Mac.
- To inspect an element without a computer, install the Web Inspector app, or use a JavaScript bookmark.
- To edit text or remove images from a website, try the Edit Webpage shortcut in the Shortcuts app.
Using Safari Developer Tools

- You will need to use a USB cable to connect , as connecting with Wi-Fi won't allow you to inspect an element.

- Open your iPhone's Settings .
- Scroll down and tap Safari .
- Scroll down and tap Advanced .
- Tap the "Web Inspector" switch to turn it on (green).

- Click the Safari menu.
- Click Settings .
- Click Advanced .
- Select "Show Develop menu in menu bar." [2] X Research source

- As you select items in the Elements tab on your Mac, you'll see the selected element highlighted on your iPhone. [3] X Research source
- If you want to continue using Inspect Element without leaving your iPhone plugged in to your Mac, click the Develop menu again and select Connect via Network .
Using the Web Inspector Extension

- Web Inspector is useful for inspecting elements in Safari as it doesn't require you to connect your iPhone to a Mac. If you want to debug in Chrome, you'll need to use a JavaScript bookmark instead.
- While this extension does have the same name as Safari's "Web Inspector," it's not an official Apple tool.

- Open Safari and go to any website.
- Tap Aa in the address bar.
- Tap Manage Extensions . [4] X Research source
- Tap the switch next to "Web Inspector" to enable it.

- To allow Web Inspector to inspect elements on this website for one day only, select Allow for One Day .
- If you choose the latter option, you won't have to give Web Inspector permission to access websites again in the future.

- When you're finished, double-tap Aa to close Web Inspector.
Using a JavaScript Bookmark

- 1 Go to the website you want to inspect. This trick involves creating a bookmark that contains a string of JavaScript code to bring Inspect Element to any iPhone web browser. This trick will work in both Safari and Chrome, though the process of creating the bookmark will be a little different.

- Chrome: Tap the three-dot menu and select Add to Bookmarks .
- Safari: Tap the Sharing icon at the bottom, then tap Add to Favorites .

- Chrome: Tap the three-dot menu and select Bookmarks at the top. Tap and hold the new bookmark, then tap Edit Bookmark. [6] X Research source
- Safari: Tap the open book icon at the bottom, then tap Favorites . Tap and hold the bookmark you just created, then tap Edit . [7] X Research source

Using the Edit Webpage Shortcut

- You'll find the Shortcuts app in your App Library. [8] X Research source
- This is helpful if you want to edit text or remove images and other objects from a website you're viewing.

- Scroll down and tap Shortcuts .
- Tap Advanced .
- Toggle on "Allow Running Scripts."

- Tap any element to edit it. Now you can edit text and images on the website without having an official Inspect Element feature built into Safari.
Expert Q&A
- Adobe Edge Inspect was a popular tool for inspecting elements on websites, but the tool is no longer in development or receiving updates. [10] X Research source Thanks Helpful 0 Not Helpful 0
- There are also several paid apps that will allow you to inspect web elements on your iPhone, including Achoo HTML Viewer & Inspector and Inspect Browser. Thanks Helpful 0 Not Helpful 0

You Might Also Like

- ↑ https://support.apple.com/guide/safari/use-the-developer-tools-in-the-develop-menu-sfri20948/mac
- ↑ https://support.apple.com/guide/safari-developer/inspecting-overview-dev1a8227029/mac
- ↑ https://support.apple.com/guide/iphone/get-extensions-iphab0432bf6/ios
- ↑ https://support.apple.com/guide/iphone/bookmark-favorite-webpages-iph42ab2f3a7/ios
- ↑ https://support.google.com/chrome/answer/188842?hl=en&co=GENIE.Platform%3DiOS&oco=0#zippy=%2Cedit-a-bookmark
- ↑ https://support.apple.com/guide/shortcuts/welcome/ios
- ↑ https://support.apple.com/en-us/guide/shortcuts/apdfeb05586f/ios
- ↑ https://helpx.adobe.com/edge-inspect/system-requirements.html
About This Article

- Send fan mail to authors
Is this article up to date?

Featured Articles

Trending Articles

Watch Articles

- Terms of Use
- Privacy Policy
- Do Not Sell or Share My Info
- Not Selling Info
wikiHow Tech Help Pro:
Level up your tech skills and stay ahead of the curve

How to Enable and Use Safari Web Inspector on iPhone in iOS 17
If you are a developer or a website manager, we are sure you know the importance of inspecting websites to analyze website issues or debug web pages. On iOS, Safari used to have a built-in Debug Console for inspecting web page issues. However, since iOS 6, Safari on iPhones has been relying on the Web Inspector tool to show to debug and analyze websites.
So, if you are looking for a way to enable the Web Inspector tool on iOS or iPadOS and use it to debug websites on your Mac, we have prepared this simple guide for you. In this article, we are going to provide step-by-step ways to enable and use the Web Inspector tool on your iOS and macOS devices. This way you will be able to easily track down issues in iOS and iPadOS websites on your macOS devices.
Enable and Use Safari Web Inspector on iPhone
Now, below we have provided the ways to enable the Web Inspector tool for Safari on iOS and macOS devices. Hence, you must already know by now that the Web Inspector tool for Safari will work only if you have a Mac or a MacBook with which you can connect your iOS device.
With the method provided here, you will be able to use the Web Inspector tool to analyze all the resources of web pages, debug, and fix underlying issues of the pages. This method can also be used with the iOS Simulator, which comes free with XCode from the Mac App Store, to view and scale web pages for different screen sizes.
Enable Web Inspector on iPhone
Before you can view the websites from the iOS Safari on your Mac using Web Inspector, you will need to enable the tool on your iOS device. You can do that using the steps right below.
1. Open the Settings app on your iPhoned.
2. Go to Safari .
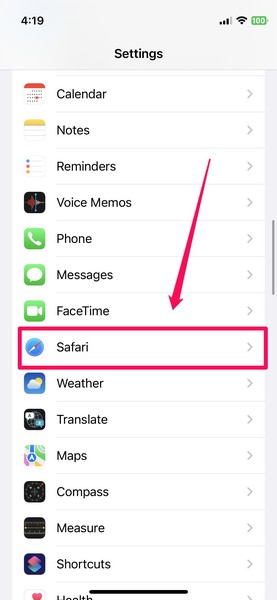
3. Scroll down to the bottom and tap the Advanced button.
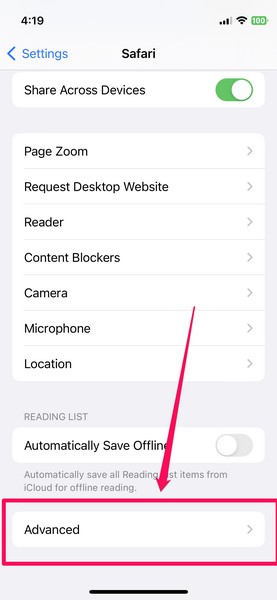
4. On the Advanced settings page, enable the toggle for Web Inspector .
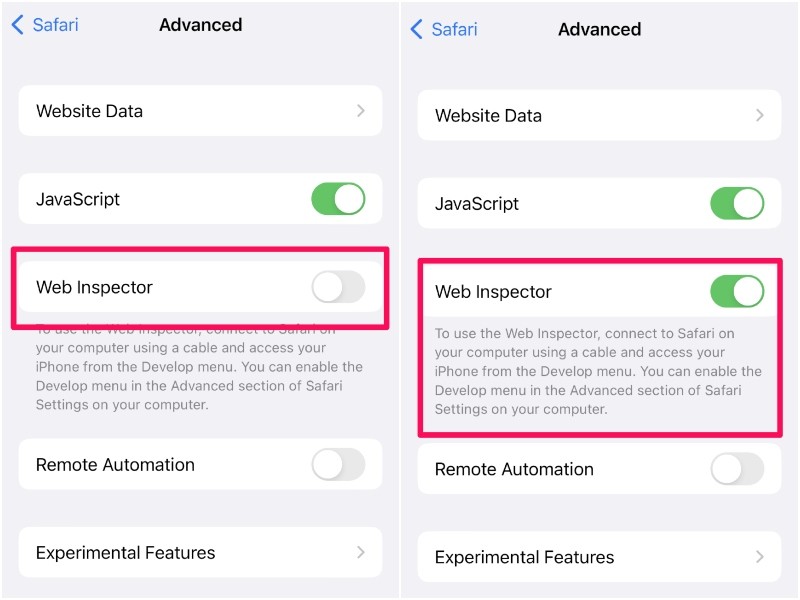
This is all you have to do to enable the Web Inspector tool on iOS. With this advanced setting enabled on your iPhone, you will be able to view and edit the websites opened on your iOS Safari right inside the Safari browser on your Mac.
However, before that, you will need to tweak a few settings in Safari on your Mac. Read on to find out how you can use the Web Inspector tool in Safari on your Mac.
Use Web Inspector for iOS Safari on Mac
Now, to use the Web Inspector tool for iOS/ iPadOS Safari on Mac, you need to connect your iPhone or iPad with the tool enabled to your Mac via a USB connection. Once both devices are connected, follow the steps below:
1. Open the Safari browser on your Mac.
2. Click the Safari option on the top navigation bar and select the Preferences option from the menu.
3. Now, go to the Advanced tab and check the box for the “Show Develop menu in menu bar” option.
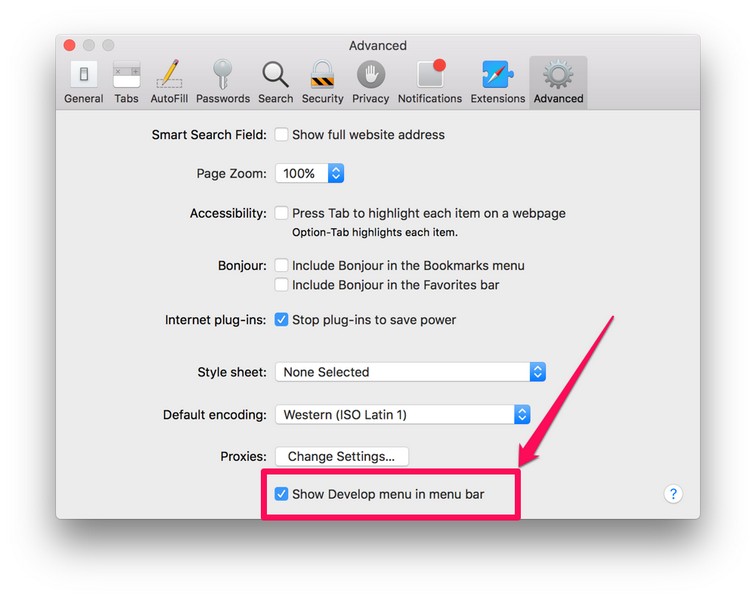
4. Exit the Settings window and you will see the new Develop menu on your Safari menu bar at the top.
5. Click the Develop option and you will see your iPhone or iPad listed.
6. Move your cursor on your device and you will see the websites opened on your iOS or iPadOS Safari appear on the drop-down list.
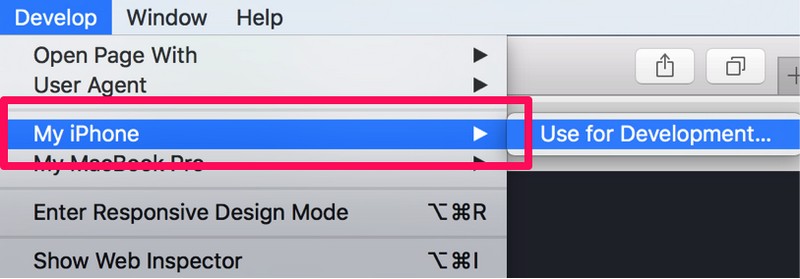
7. From here, you can click the website that you want to open in the Web Inspector console on your Mac for optimization and debugging.
So, this way, you can easily enable and use the Web Inspector tool for Safari on your iPhone or iPad and analyze websites on your Mac. The Web Inspector is especially useful if you are a macOS developer who also develops or manages iOS websites. With this, you can easily view the web pages from iPhones or iPads on your Mac and tinker with them to improve their quality and fix other issues.
How can I enable Web Inspector on my iPad?
The process of enabling the Web Inspector tool on iPhones and iPads is pretty much the same. Hence, you can use the method provided in this article to easily enable Web Inspector in Safari on your iPad and your iPhone.
Can I inspect web pages on my iPhone or iPad?
Although you can enable the Web Inspector tool in Safari on your iPhone or iPad, you will require a macOS device and a USB-Lightning cable to actually use the tool for inspecting web pages.
How can I bring up the Web Inspector console on Mac?
After enabling the Develop menu in the menu bar in Safari on your Mac (steps provided above), you can click the Develop option in Safari and select your connected iPhone or iPad to view the web pages. From here, you can click a web page and the Web Inspector console will open up the resources.
Final Words
So, this was all about enabling and using the Web Inspector tool in Safari on iPhones and iPads. It is a great tool for website developers to prototype, optimize, and debug web content on iOS, iPadOS, and macOS devices. And if this guide added value to your work or helped you in any way, do let us know in the comments below.
Dwaipayan Sengupta
After graduating with a Bachelor's in Business Administration, Dwaipayan has worked for reputable media firms such as Beebom and Pinkvilla. He has written over 1500 articles in his 3+ years of writing career and specializes in How-tos about Windows issues and features, flash news, and custom mechanical keyboards. When he is not writing or customizing mechanical keyboards, you can find him playing an intense Valorant match or browsing through his Reddit feed.
You may also like

How to Enable and Use Live Captions in FaceTime on Mac in macOS 15 Sequoia
How to Fix JavaScript Not Working in Safari on iPhone

How to Use InSight, Enhance Dialogue, and Automatic Subtitles in Apple TV+ on iPhone in iOS 18
How to Use the Calendar App on Windows 11
Leave a reply cancel reply.
Your email address will not be published. Required fields are marked *
Save my name, email, and website in this browser for the next time I comment.
How to Use Inspect Element in Chrome, Safari, & Firefox
Published: May 20, 2024
When I started my coding journey, I couldn’t always pinpoint what made a web page great — all of the code underneath that craft a well-designed experience. So, I would use the inspect element on my browser to peel back the curtain. Here, I could see how pages were coded so I could understand how to recreate elements for my own projects.

The inspect element feature lets us view and even modify any website’s front end. This simple trick can help you understand how websites work and even help you build your own.
In this post, I’ll discuss what it means to “inspect” page elements and how to do so on three common web browsers. If you’re in a pinch, jump ahead to what you’re looking for.
Table of Contents
How to Inspect Elements in Chrome
How to inspect elements in safari, how to inspect elements in firefox, get a closer look with inspect, what does “inspect element” mean.
Inspect element is a feature of modern web browsers that enables anyone to view and edit a website’s source code, including its HTML, CSS, JavaScript, and media files. When the source code is modified with the inspect tool, the changes are shown live inside the browser window.
Inspect is a web professional’s scout team. Developers, designers, and marketers frequently use it to peek inside any website (including their own) to preview content and style changes, fix bugs, or learn how a particular website is built. For instance, if I find an intriguing interface on a competing website, the inspect element lets me see the HTML and CSS that make it up.
I also think of my browser’s inspect feature as a “sandbox” of sorts. I can play around with a web page as much as I want by changing content, colors, fonts, layouts, etc. When finished, I just refresh the page to revert everything to normal.
Inspect doesn’t change the website itself — only how it appears in your browser. You can then experiment without worry!
Inspect is also an incredibly valuable tool for those learning web development. Instead of viewing plain source code, I can use the inspect element to interact with the page and see how each line of code maps to an element or style.
By better understanding what constitutes the typical web page, I can communicate effectively with developers in the case of an error or if I want to make a change.
Inspect may be a “developer tool,” but you don’t need to write any code or install any additional software to use it. You can do everything I’ve described right inside your browser. Let’s learn how.
How to Inspect Elements
To inspect elements, you have to right-click any part of a web page and click Inspect > Inspect Element. Alternatively, you can press Command+Option+i on your Mac or F12 on your PC to do the same.
Every modern web browser has a native tool for inspecting elements. It can be accessed in any browser, but some browsers like Chrome and Safari have slight differences. Let’s discuss how to use the inspect tool in three desktop web browsers: Google Chrome, Apple’s Safari, and Mozilla Firefox.
Chrome comes with a handy developer tool that allows you to inspect individual elements. This allows you to see the code behind a web page and even edit it on your own browser. (Note that the changes are only visible to you, not to anyone else across the web.)
Here's how to get started.

Free Guide: 25 HTML & CSS Coding Hacks
Tangible tips and coding templates from experts to help you code better and faster.
- Coding to Convention
- Being Browser-Friendly
- Minimizing Bugs
- Optimizing Performance
Download Free
All fields are required.
You're all set!
Click this link to access this resource at any time.
1. Launch Chrome and navigate to the page you want to inspect.
To use the element inspector in Google Chrome, I first navigate to any web page. In these examples, I’ll be using HubSpot.com .
2. Open up the Inspect panel.
Once I arrive at my desired page, I have several ways to open Chrome's Inspect tool.
- Option 1 : I can right-click any part of the page and choose Inspect . Right-clicking a specific page element will open that element in the inspector view.
- Option 2 : In the top menu bar, I can select View > Developer > Developer Tools .
- Option 3: I can click the three-dot icon in the top right corner of the browser window. From there, I can choose More Tools > Developer Tools . Then, I can click the Inspect tab in the popup.
- Option 4 : I can use the shortcut control-shift-C on Windows or command-option-C on macOS.
3. Change the location of the inspect panel.
To better view the code, I can change the position of the inspector window.
The Chrome Developer Tools panel will open at the bottom of the browser window, but sometimes it opens in a separate window altogether.
If I want to change the location of the panel, I can click the three-dots icon in the top right corner of the panel (next to the X icon), and then choose my preferred dock position.
Pro tip: Choosing Dock to right makes it easier to view the rendered page and its source:

Along the top of the inspect panel, I see tabs for Elements , Console , Sources , etc. These are all tools I can use to assess a page’s contents and performance. However, everything I need to inspect is under the Elements tab.
4. Look at the source HTML code of the page.
The biggest area of the panel will contain the source HTML of the current page. I always spend some time exploring this region. Hovering the cursor over the piece of code highlights the corresponding element on the page.
Blue indicates the contents of an element, green corresponds to padding, and areas in orange are margins.
Pro tip: If you’re a beginner and want to learn more about the different elements you’re inspecting, check out this HTML guide for beginners.
5. Select a specific element to inspect.
Rather than trying to read through the code to find an element, I can also do the opposite. I can locate a piece of code by hovering over the page element itself. To do this, I click the Element select icon in the top left corner of the panel.

8. Edit the page's CSS code.
Moving down the Chrome inspect panel, I see the Styles tab. This shows me what CSS styling has been applied to the selected element. I can click on lines of code to rewrite them, or I can activate/deactivate certain declarations by checking/unchecking the boxes next to them. I’ll do this for my <h1> element’s font-weight property:
9. View the page's mobile version.
Finally, let’s cover one more feature of Chrome’s inspect feature: mobile view. When building a site, designers need to consider how its pages appear on desktop, mobile, and tablet screens alike.
Fortunately, Chrome lets me preview the same web page in multiple screen resolutions. Start by clicking the Toggle device icon in the top left corner of the panel:

Now, when I click a page element, the Web Inspector reveals the corresponding source code.
7. Edit, add, or delete page elements.
Like Chrome’s inspector, Safari lets me modify, add, and remove page elements. To edit the page, I can right-click an HTML element in the inspect panel. I can then choose an option from the Edit menu.
Web Inspector will prompt me for a new text input and then display my changes in real time:

If I want to delete a page element, I just select some code and delete it. Or, I can right-click and choose Toggle Visibility to hide an element without deleting it.
8. Activate or deactivate the page's CSS code.
To the right, I have the Styles column, where I can change or activate/deactivate CSS declarations for any element, like so:
When testing content and style changes, I want to see the effect on mobile screens as well as desktops. I’ll cover that next.
Pro tip: When seeking inspiration from other web pages, I always take advantage of the Styles tab in my browser’s developer tools to tailor the CSS according to how I envision it on my own page. Try it out. This allows you to refine and adapt design elements to suit your specific preference before moving forward with coding it in your own workspace.
Safari’s Responsive Design Mode allows me to preview a website across common devices.
To view the page in a mobile viewport, I choose Develop → Enter Responsive Design Mode . In this mode, I can use the same inspector tools on pages formatted for Apple devices or set the dimensions myself:

What I like: Safari’s responsive design tab not only lets you test your web page’s responsiveness on devices, but you can also test its behavior across different browsers. Serving as a one-stop-shop for testing responsiveness, the Safari dev tools are a huge time saver.
Firefox is another great option for inspecting a web page in either macOS, Windows, or Linux. Here’s how to get started.
1. Open Firefox's inspect element tool.
To open the Firefox Inspector, I have several options:
- Option 1: I can right-click any part of the page and choose Inspect Element . Right-clicking a specific page element will open that element in the inspector view.
- Option 2: I can select Tools → Browser Tools → Web Developer Tools from the top menu bar.
- Option 3: I can use the shortcut control-shift-I or press f12 in Windows or command-option-I in macOS.
Next, I go to the web page I’d like to inspect. I’ll be using HubSpot.com again.
3. Change the location of the inspector panel.
The Firefox inspector appears along the bottom of the window by default. To change its position, I can select the three-dots icon in the top right corner of the inspector, then choose an alternative display option.

4. Look at the HTML code of the page.
Firefox’s inspector panel is comparable in features to Chrome’s and Safari’s. The HTML source code indicates the corresponding page element with color codes — content is blue, padding is purple, and margins are yellow:
I can also find code by selecting elements on the page. To enter selection mode, I click the cursor icon in the top left corner:

I can then click any page element to reveal its source code in the inspect panel.
6. Modify or delete page elements.
To modify or delete a page element, I select its code in the inspector. Then, I can either double-click to change the text, right-click and choose Edit as HTML, or click Plus Button next to the “Search HTML” bar to add code. Or I can simply delete the code and see the resulting changes on the page.

7. Toggle the page's CSS styles.
To toggle the CSS styling of an element, I use the Filter Styles region at the bottom of the inspect panel. There, I can uncheck the box next to a CSS declaration to deactivate it (or write in new code myself):
8. View the page's mobile version.
Finally, Firefox’s tools also come with a mobile preview option. To use it, I can click the Responsive Design Mode icon in the top right corner of the panel:

Responsive Design Mode lets me choose from several preset screen resolutions or set my own. I can also toggle connection speed and device pixel ratio:

What I like: As a software developer, it is very important that I make web pages that can be easily used by anyone. Firefox’s accessibility tab in its inspector tool allows me to check if my nodes accessibility tree is missing any important properties. I can verify color contrasts too.
The quickest way to access this feature is by right clicking on the page → choose Inspect → select the two arrows next to debugger → select Accessibility .
Once you learn the basics of your browser’s inspect tool, you might realize just how much information about your favorite websites is publicly available. With a few clicks, you can explore how exactly web pages are built, what styles they use, how they optimize for search engines, how they format on mobile screens, and a lot more.
Editor's note: This article was originally published in December 2020 and has been updated for comprehensiveness.

Don't forget to share this post!
Related articles.

11 Web Development Trends to Expect in 2024, According to Experts & Data

A Simple Explanation of SSL Certificate Errors & How to Fix Them
![safari inspect console How to Make a Website With User Accounts and Profiles [With WordPress, Wix, and More]](https://knowledge.hubspot.com/hubfs/make-website-with-user-accounts-1-20240712-739219.webp)
How to Make a Website With User Accounts and Profiles [With WordPress, Wix, and More]

How to Start Coding: The Ultimate Guide for Beginner Programmers

XML Files: What They Are & How to Open Them

The Beginner's Guide to Website Development
![safari inspect console How to Get an SSL Certificate [+10 Best Free SSLs]](https://www.hubspot.com/hubfs/free-ssl%20%284%29.webp)
How to Get an SSL Certificate [+10 Best Free SSLs]

Are .io Domains Good? Why Tech Startups Love .io Domains

15 Backend Project Ideas for Your Developer Portfolio

37 Backend Interview Questions and Answers: The Ultimate Guide 2022
CMS Hub is flexible for marketers, powerful for developers, and gives customers a personalized, secure experience
Safari Web Inspector Guide
- Table of Contents
- Jump To…
- Download Sample Code
Retired Document
Important: This document no longer represents the most current version of Safari developer tools. Links to downloads and other resources may no longer be valid. For new documentation on Safari Web Inspector, please visit Safari Developer Help .
The Console
The console offers a way to inspect and debug your webpages. Think of it as the Terminal of your web content. The console has access to the DOM and JavaScript of the open page. Use the console as a tool to modify your web content via interactive commands and as a teaching aid to expand your knowledge of JavaScript. Because an object’s methods and properties autocomplete as you type, you can see all available functions that are valid in Safari.
For example, open the console and type $$(‘p’)[1] . ( $$ is shorthand for document.querySelectorAll —see more shorthand commands in Table 5-1 .) Because this paragraph is the second instance of the p element on this page ( [1] in a 0-based index), the node represents this paragraph. As you hover over the node, its position on the page is visibly highlighted. You can expand the node to see its contents, and even press Command-C to copy it to your clipboard.
Command-Line API
You can inspect HTML nodes and JavaScript objects in more detail by using the console commands listed in Table 5-1 . Type the command-line APIs interactively within the console.
If your scripts share the same function name as a Command-Line API function, the function in your scripts takes precedence.
The functions listed in Table 5-1 are regular JavaScript functions that are part of the Web Inspector environment. That means you can use them as you would any JavaScript function. For example, you can assign a chain of Console API commands to a variable to create a useful shorthand. Listing 5-1 shows how you can quickly see all event types attached to the selected node.
Listing 5-1 Find the events attached to this element
After defining this function, inspect the magnifying glass in the top-right corner of this webpage, and type evs() in the console. An array containing the string “click” is returned, because there is a click event listener attached to that element.
Of course, these functions shouldn’t be included in your website’s JavaScript files because they are not available in the browser environment. Only use these functions in the Web Inspector console. Console functions you can include in your scripts are described in Console API .
Console API
You can output messages to the console, add markers to the timeline, and control the debugger directly from your scripts by using the commands listed in Table 5-2 .
Copyright © 2018 Apple Inc. All Rights Reserved. Terms of Use | Privacy Policy | Updated: 2018-02-07

IMAGES
COMMENTS
A step-by-step tutorial on how to activate the Debug Console or Web Inspector in Safari for the iPhone and other iOS devices.
Web Inspector helps you inspect all the resources and activity on webpages, Service Workers, Mac and Home Screen web apps, and JavaScript running inside your applications, making development more efficient across Apple platforms. The clean, unified design puts each core function in a separate tab, which you can rearrange to fit your workflow.
I am developing websites and creating applications. I want to know how to inspect an element through web browsers like safari. In normal Chrome, Firefox, Explorer or any other browsers, we will r...
In Safari, there are two ways to begin inspecting a webpage. The first is via the Develop menu. With the webpage you wish to inspect frontmost in Safari, go to the Develop menu and choose Show Web Inspector (⌥⌘I). Web Inspector will then appear, and will be inspecting the webpage. The second was to show Web Inspector is to right click on ...
Inspecting a webpage Webpages you open in Safari in iOS and iPadOS appear in a submenu for the connected device of the Develop menu of Safari on a connected Mac. Safari groups webpages and other content by app, making it easier to find the webpage you want to inspect.
To enable Inspect Element, you first have to switch on Safari's Developer Menu. If you aren't sure how, fear not, as this guide will show you exactly how to Inspect Element on Safari.
Console is a Command Line API that allows you to debug Safari on iPhone using Developer Tools. The Console allows access to the DOM and JavaScript of the open page, allowing you to inspect HTML nodes and JavaScript objects in more detail by using the console commands.
Learn how to inspect element on Mac with Safari browser and the benefits of a Real Device Cloud for testing under real user conditions.
Safari Developer Tools is a set of web development tools built into Apple's Safari web browser. It allows developers to inspect, debug, and optimize their web applications.
Need to use web inspector to modify, debug, or optimize a website or app for Safari? Learn how to use this tool to get the best performance?!
When you right-click on any web page in Safari on Mac, it doesn't reveal the Show Page Source and Inspect Element buttons. To see these, you need to enable the Develop menu---we'll show you how to do that.
In Safari on your Mac, use the developer tools to make sure a website you create works well with all standard web browsers.
Whether you're a web development beginner or just starting to develop with Safari, here's how to use Safari Web Inspector on iOS and Mac.
Apple has brought its expertise in development tools to the web. Safari includes Web Inspector, a powerful tool that makes it easy to modify, debug, and optimize websites for peak performance and compatibility on both platforms. And with Responsive Design Mode, you can preview your web pages in various screen sizes, orientations, and resolutions.
How to debug HTML and JS in Safari iOS, SFSafariViewController, and WKWebView using Web Inspector on macOS.
Use Safari Developer Tools to inspect elements by connecting your iPhone to your Mac. To inspect an element without a computer, install the Web Inspector app, or use a JavaScript bookmark.
On iOS, Safari used to have a built-in Debug Console for inspecting web page issues. However, since iOS 6, Safari on iPhones has been relying on the Web Inspector tool to show to debug and analyze websites.
Learn how to view and modify the underlying code of a web page with the inspect element tool in the Chrome, Safari, and Firefox web browsers.
0 I've used Safari as my main browser for web dev for years now and at some point fairly recently what I think of as the 'mini' console has started to open automatically whenever I right-click and select Inspect Element. I'm talking about the minimisable console here (highlighted in yellow below) rather than the dedicated Console tab.
Describes the developer tool built into Safari that helps you prototype, optimize, and debug web content.
Step 1: To open the console in Firefox, use this keyboard shortcut: Cmd + Option +K (on a Mac) or Ctrl +Shift +J (on Windows). As an alternative, you can right-click on the webpage and click "Inspect Element" to show the developer window. Step 2: Select the "Console" tab in that window. Step 3: From there, repeat the action that is causing you ...