- All Teaching Materials
- New Lessons
- Popular Lessons
- This Day In People’s History
- If We Knew Our History Series
- New from Rethinking Schools
- Workshops and Conferences
- Teach Reconstruction
- Teach Climate Justice
- Teaching for Black Lives
- Teach Truth
- Teaching Rosa Parks
- Abolish Columbus Day
- Project Highlights

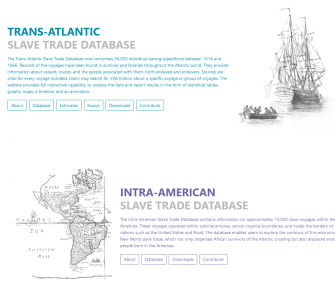
Trans-Atlantic and Intra-American Slave Trade Database
Digital collection. Through this website, over 130,000 voyages made in the Trans-Atlantic and Intra-American slave trade can be searched, filtered, and sorted by variables including the port of origin, the number of enslaved Africans on board, and the ship’s name.
- Click to email a link to a friend (Opens in new window)
- Click to share on Pinterest (Opens in new window)
- Click to share on Twitter (Opens in new window)
- Click to share on Facebook (Opens in new window)
The new Voyages website is the product of three years of development by a multi-disciplinary team of historians, librarians, curriculum specialists, cartographers, computer programmers, and web designers, in consultation with scholars of the slave trade from universities in Europe, Africa, South America, and North America.
The Slave Trade Databases comprise tens of thousands of individual slaving expeditions between 1514 and 1866. Records of the Trans-Atlantic and Intra-American voyages have been found in archives and libraries throughout the Atlantic world. They provide information about vessels, routes, and the people associated with them, both enslaved and enslavers. Sources are cited for every voyage included. Users may search for information about a specific voyage or group of voyages. The website provides full interactive capability to analyze the data and report results in the form of statistical tables, graphs, maps, a timeline, and an animation.
The voyages database for Trans-Atlantic and Intra-American slave trade can be searched, filtered, and sorted by variables like “Principal Place of Purchase, destination, and ship’s name.
The database enables users to explore the Trans-Atlantic trade routes as well as the contours of the enormous New World slave trade, which not only dispersed African survivors of the Atlantic crossing but also displaced enslaved people born in the Americas. These voyages operated within colonial empires, across imperial boundaries, and inside the borders of nations such as the United States and Brazil.
Share a story, question, or resource from your classroom.
Your email address will not be published. Required fields are marked *
More Teaching Resources

A Digital Archive of Slave Voyages Details the Largest Forced Migration in History
An online database explores the nearly 36,000 slave voyages that occurred between 1514 and 1866
Philip Misevich, Daniel Domingues, David Eltis, Nafees M. Khan and Nicholas Radburn, The Conversation
/https://tf-cmsv2-smithsonianmag-media.s3.amazonaws.com/filer/34/f3/34f347e3-5cb1-4e16-ae27-bf153a1b25db/file-20170427-15097-19mqhh2.jpg "slave voyages database")
Between 1500 and 1866, slave traders forced 12.5 million Africans aboard transatlantic slave vessels. Before 1820, four enslaved Africans crossed the Atlantic for every European, making Africa the demographic wellspring for the repopulation of the Americas after Columbus’ voyages. The slave trade pulled virtually every port that faced the Atlantic Ocean – from Copenhagen to Cape Town and Boston to Buenos Aires – into its orbit.
To document this enormous trade – the largest forced oceanic migration in human history – our team launched Voyages: The Trans-Atlantic Slave Trade Database , a freely available online resource that lets visitors search through and analyze information on nearly 36,000 slave voyages that occurred between 1514 and 1866.
Inspired by the remarkable public response, we recently developed an animation feature that helps bring into clearer focus the horrifying scale and duration of the trade. The site also recently implemented a system for visitors to contribute new data. In the last year alone we have added more than a thousand new voyages and revised details on many others.
The data have revolutionized scholarship on the slave trade and provided the foundation for new insights into how enslaved people experienced and resisted their captivity. They have also further underscored the distinctive transatlantic connections that the trade fostered.

Records of unique slave voyages lie at the heart of the project. Clicking on individual voyages listed in the site opens their profiles, which comprise more than 70 distinct fields that collectively help tell that voyage’s story.
From which port did the voyage begin? To which places in Africa did it go? How many enslaved people perished during the Middle Passage? And where did those enslaved Africans end the oceanic portion of their enslavement and begin their lives as slaves in the Americas?
Working with complex data
Given the size and complexity of the slave trade, combining the sources that document slave ships’ activities into a single database has presented numerous challenges. Records are written in numerous languages and maintained in archives, libraries and private collections located in dozens of countries. Many of these are developing nations that lack the financial resources to invest in sustained systems of document preservation.
Even when they are relatively easy to access, documents on slave voyages provide uneven information. Ship logs comprehensively describe places of travel and list the numbers of enslaved people purchased and the captain and crew. By contrast, port-entry records in newspapers might merely produce the name of the vessel and the number of captives who survived the Middle Passage.
These varied sources can be hard to reconcile. The numbers of slaves loaded or removed from a particular vessel might vary widely. Or perhaps a vessel carried registration papers that aimed to mask its actual origins, especially after the legal abolition of the trade in 1808.
Compiling these data in a way that does justice to their complexity, while still keeping the site user-friendly, has remained an ongoing concern .
Of course, not all slave voyages left surviving records. Gaps will consequently remain in coverage, even if they continue to narrow. Perhaps three out of every four slaving voyages are now documented in the database. Aiming to account for missing data, a separate assessment tool enables users to gain a clear understanding of the volume and structure of the slave trade and consider how it changed over time and across space.
Engagement with Voyages site
While gathering data on the slave trade is not new, using these data to compile comprehensive databases for the public has become feasible only in the internet age. Digital projects make it possible to reach a much larger audience with more diverse interests. We often hear from teachers and students who use the site in the classroom, from scholars whose research draws on material in the database and from individuals who consult the project to better understand their heritage.
Through a contribute function , site visitors can also submit new material on transatlantic slave voyages and help us identify errors in the data.
The real strength of the project – and of digital history more generally – is that it encourages visitors to interact with sources and materials that they might not otherwise be able to access. That turns users into historians, allowing them to contextualize a single slave voyage or analyze local, national and Atlantic-wide patterns. How did the survival rate among captives during the Middle Passage change over time? What was the typical ratio of male to female captives? How often did insurrections occur aboard slave ships? From which African port did most enslaved people sent to, say, Virginia originate?
Scholars have used Voyages to address these and many other questions and have in the process transformed our understanding of just about every aspect of the slave trade. We learned that shipboard revolts occurred most often among slaves who came from regions in Africa that supplied comparatively few slaves. Ports tended to send slave vessels to the same African regions in search of enslaved people and dispatch them to familiar places for sale in the Americas. Indeed, slave voyages followed a seasonal pattern that was conditioned at least in part by agricultural cycles on both sides of the Atlantic Ocean. The slave trade was both highly structured and carefully organized.
The website also continues to collect lesson plans that teachers have created for middle school, high school and college students. In one exercise, students must create a memorial to the captives who experienced the Middle Passage, using the site to inform their thinking. One recent college course situates students in late 18th-century Britain, turning them into collaborators in the abolition campaign who use Voyages to gather critical information on the slave trade’s operations.
Voyages has also provided a model for other projects, including a forthcoming database that documents slave ships that operated strictly within the Americas.
We also continue to work in parallel with the African Origins database. The project invites users to identify the likely backgrounds of nearly 100,000 Africans liberated from slave vessels based on their indigenous names. By combining those names with information from Voyages on liberated Africans’ ports of origin, the Origins website aims to better understand the homelands from which enslaved people came.
Through these endeavors, Voyages has become a digital memorial to the millions of enslaved Africans forcibly pulled into the slave trade and, until recently, nearly erased from the history of not only the trade itself, but also the history of the Atlantic world.
Philip Misevich, Assistant Professor of History, St. John's University
Daniel Domingues, Assistant Professor of History, University of Missouri-Columbia
David Eltis, Professor Emeritus of History, Emory University
Nafees M. Khan, Lecturer in Social Studies Education, Clemson University
Nicholas Radburn, Postdoctoral Fellow, University of Southern California – Dornsife College of Letters, Arts and Sciences
Get the latest History stories in your inbox?
Click to visit our Privacy Statement .
- Search Grant Programs
- Application Review Process
- Manage Your Award
- Grantee Communications Toolkit
- Search All Past Awards
- Divisions and Offices
- Professional Development
- Workshops, Resources, & Tools
- Sign Up to Be a Panelist
- Emergency and Disaster Relief
- Equity Action Plan
- States and Jurisdictions
- Featured NEH-Funded Projects
- Humanities Magazine
- Information for Native and Indigenous Communities
- Information for Pacific Islanders
- Search Our Work
- American Tapestry
- Federal Indian Boarding School Initiative
- Humanities Perspectives on Artificial Intelligence
- Pacific Islands Cultural Initiative
- United We Stand: Connecting Through Culture
- A More Perfect Union
- NEH Leadership
- Open Government
- Contact NEH
- Press Releases
- NEH in the News
Voyages: The Trans-Atlantic Slave Trade Database
Office of digital humanities.

Overview of the slave trade out of Africa, 1500-1900.
Courtesy of slavevoyages.com
Track the journeys of over 10-12.5 million Africans forced into slavery with this searchable database of passenger records from 36,000 trans-Atlantic slave ship voyages.
Related on NEH.gov
Voyages: the transatlantic slave trade database, moldy church records in latin america document the lives of millions of slaves.
Weekly hours for all locations
E-resource - SlaveVoyages: The Trans-Atlantic and Intra-American Slave Trade Database
SlaveVoyages is the world's largest archive of data related to the trans-Atlantic and intra-American slave trades. This database includes data on over 30,000 British, French, and Dutch ships that forced roughly 12 million Africans across the Atlantic between the 16th -19th centuries as well as data on hundreds of thousands of enslaved peoples that were trafficked within the Americas. This resource also includes images, maps, ship routes, information on morality rates aboard the ships, the number of children transported, the names of ship captains, and information related to resistance and rebellions.
https://www.slavevoyages.org/
This database is made possible by the collaborative effort of Emory University, the Hutchins Center for African and African American Research at Harvard University, the Nation Museum of African American History and Culture, the Omohundro Institute of Early American History and Culture at William and Mary, Rice University, and the University of California.
For more information about using this database, please view the publisher's online tutorial.
- Lesson Plans
- Teacher's Guides
- Media Resources
Slave Voyages

Transatlantic Slave Trade Database
Library of Congress
Slave Voyages: The Transatlantic Slave Trade Database is an NEH-funded digital humanities project that represents decades of careful research and documentation. Scholars worked to collect information about the voyages of enslaved people, first across the Atlantic and then within the Americas, and to transfer unpublished archival records into machine-readable data.
This data can be downloaded by researchers and students around the world, or viewed in various formats on the project's website. In addition to the databases of voyages that form the core of the project, recently, the project team has incorporated an archive of images, a database of the names of enslaved people , a 3-D animation of a slave ship, and other visualizations. There is also a series of essays about the slave trade that address both the micro—individual experiences of captivity and enslavement—and macro—the centuries-long evolution of the slave trade(s).
The databases can, of course, be used as sources for research projects. However, they also offer an opportunity to reflect on the challenges of historical research and representation more broadly: how can we understand histories of individuals and phenomena when surviving documentation is most often from the perspective of the enslaver, the plantation owner, the accountant?
Classroom Connections
After students have studied one or more slave narratives, ask them to explore the Slave Voyages site . The Trans-Atlantic Database is the most robust and has the most visualization options. Students should examine the database itself, as well as the different data visualizations on the site. The following questions can guide reflection.
- What information is conveyed in the slave narrative? In the database?
- How is this information conveyed?
- What do you think is the purpose of slave narratives? The Slave Voyages databases?
- What sources were used to write slave narratives? To build the Slave Voyages databases?
- What are some of the strengths and limitations of each form of representing slavery and the lives of enslaved people?
- How has each representation of slavery shaped your knowledge and perceptions of the institution?
Students can analyze a different form of representing enslaved persons' lives in EDSITEment's collection of lesson plans about slave narratives.
- Twelve Years a Slave: Analyzing Slave Narratives (grades 9-12)
- Perspective on the Slave Narrative (grades 9-12)
Frederick Douglass’s Narrative : Myth of the Happy Slave (grades 9-12)
Slave Narratives: Constructing U.S. History through Analyzing Primary Sources (grades 6-8)
Related on EDSITEment
Frederick douglass’s narrative : myth of the happy slave, people not property : stories of slavery in the colonial north, perspective on the slave narrative, twelve years a slave : analyzing slave narratives, solomon northup’s twelve years a slave and the slave narrative tradition, ask an neh expert: validating sources, harriet tubman and the underground railroad, lesson 2: from courage to freedom: slavery's dehumanizing effects.
- Utility Menu
78f981343302d08a3898fa75f2fa93ed
442bbfbc0567d8782d1d94a88dd9a691
Trans-atlantic slave trade database.
Director: David Eltis (Emory University)
The Trans-Atlantic Slave Trade Database, originally published as a CD-ROM in 1999, has been available in a new and greatly expanded format on an open access website since December, 2008 and is periodically updated as new information becomes available. It is located at http://www.slavevoyages.org . It includes detailed information on 35,000 transatlantic slave trading voyages that occurred between 1520 and 1866 as well as estimates of the overall size and direction of the trade. Detailed personal information on over 90,000 Africans removed from captured slave ships in the nineteenth century, including their African names, is accessible at http://www.african-origins.org . David Eltis and David Richardson’s Atlas of the Transatlantic Slave Trade (New Haven, 2010) draws heavily on slavevoyages.org and african-origins.org . Slavevoyages.org has recently completed a recode and is now proceeding with additional development that will provide access to a database on the intra-American traffic. This threeyear project, supported by the National Endowment for the Humanities, Emory University, the Universities of California at Irvine and Santa Cruz, and the Hutchins Center for African & African American Research, will underwrite the site’s sustainability over the next decade and will be completed in 2018. Further development on identification of the people involved in the transatlantic slave around the Atlantic basins is also underway supported by the Andrew W. Mellon Foundation.

Philip Misevich, St. John's University Philip Misevich, St. John's University
Daniel Domingues, University of Missouri-Columbia Daniel Domingues, University of Missouri-Columbia
David Eltis, Emory University David Eltis, Emory University
Nafees M. Khan, Clemson University Nafees M. Khan, Clemson University
Nicholas Radburn, University of Southern California Nicholas Radburn, University of Southern California
Leave your feedback
- Copy URL https://www.pbs.org/newshour/nation/digital-archive-slave-voyages-details-largest-forced-migration-history
This digital archive of slave voyages details the largest forced migration in history
Between 1500 and 1866, slave traders forced 12.5 million Africans aboard transatlantic slave vessels. Before 1820, four enslaved Africans crossed the Atlantic for every European, making Africa the demographic wellspring for the repopulation of the Americas after Columbus’ voyages. The slave trade pulled virtually every port that faced the Atlantic Ocean – from Copenhagen to Cape Town and Boston to Buenos Aires – into its orbit.
To document this enormous trade – the largest forced oceanic migration in human history – our team launched Voyages: The Trans-Atlantic Slave Trade Database , a freely available online resource that lets visitors search through and analyze information on nearly 36,000 slave voyages that occurred between 1514 and 1866.
Inspired by the remarkable public response, we recently developed an animation feature that helps bring into clearer focus the horrifying scale and duration of the trade. The site also recently implemented a system for visitors to contribute new data. In the last year alone we have added more than a thousand new voyages and revised details on many others.
The data have revolutionized scholarship on the slave trade and provided the foundation for new insights into how enslaved people experienced and resisted their captivity. They have also further underscored the distinctive transatlantic connections that the trade fostered.
Records of unique slave voyages lie at the heart of the project. Clicking on individual voyages listed in the site opens their profiles, which comprise more than 70 distinct fields that collectively help tell that voyage’s story.
From which port did the voyage begin? To which places in Africa did it go? How many enslaved people perished during the Middle Passage? And where did those enslaved Africans end the oceanic portion of their enslavement and begin their lives as slaves in the Americas?
Working with complex data
Given the size and complexity of the slave trade, combining the sources that document slave ships’ activities into a single database has presented numerous challenges. Records are written in numerous languages and maintained in archives, libraries and private collections located in dozens of countries. Many of these are developing nations that lack the financial resources to invest in sustained systems of document preservation.
Even when they are relatively easy to access, documents on slave voyages provide uneven information. Ship logs comprehensively describe places of travel and list the numbers of enslaved people purchased and the captain and crew. By contrast, port-entry records in newspapers might merely produce the name of the vessel and the number of captives who survived the Middle Passage.
These varied sources can be hard to reconcile. The numbers of slaves loaded or removed from a particular vessel might vary widely. Or perhaps a vessel carried registration papers that aimed to mask its actual origins, especially after the legal abolition of the trade in 1808.
Compiling these data in a way that does justice to their complexity, while still keeping the site user-friendly, has remained an ongoing concern .
Of course, not all slave voyages left surviving records. Gaps will consequently remain in coverage, even if they continue to narrow. Perhaps three out of every four slaving voyages are now documented in the database. Aiming to account for missing data, a separate assessment tool enables users to gain a clear understanding of the volume and structure of the slave trade and consider how it changed over time and across space.
Engagement with Voyages site
While gathering data on the slave trade is not new, using these data to compile comprehensive databases for the public has become feasible only in the internet age. Digital projects make it possible to reach a much larger audience with more diverse interests. We often hear from teachers and students who use the site in the classroom, from scholars whose research draws on material in the database and from individuals who consult the project to better understand their heritage.
Through a contribute function , site visitors can also submit new material on transatlantic slave voyages and help us identify errors in the data.
The real strength of the project – and of digital history more generally – is that it encourages visitors to interact with sources and materials that they might not otherwise be able to access. That turns users into historians, allowing them to contextualize a single slave voyage or analyze local, national and Atlantic-wide patterns. How did the survival rate among captives during the Middle Passage change over time? What was the typical ratio of male to female captives? How often did insurrections occur aboard slave ships? From which African port did most enslaved people sent to, say, Virginia originate?
Scholars have used Voyages to address these and many other questions and have in the process transformed our understanding of just about every aspect of the slave trade. We learned that shipboard revolts occurred most often among slaves who came from regions in Africa that supplied comparatively few slaves. Ports tended to send slave vessels to the same African regions in search of enslaved people and dispatch them to familiar places for sale in the Americas. Indeed, slave voyages followed a seasonal pattern that was conditioned at least in part by agricultural cycles on both sides of the Atlantic Ocean. The slave trade was both highly structured and carefully organized.
The website also continues to collect lesson plans that teachers have created for middle school, high school and college students. In one exercise, students must create a memorial to the captives who experienced the Middle Passage, using the site to inform their thinking. One recent college course situates students in late 18th-century Britain, turning them into collaborators in the abolition campaign who use Voyages to gather critical information on the slave trade’s operations.
Voyages has also provided a model for other projects, including a forthcoming database that documents slave ships that operated strictly within the Americas.
We also continue to work in parallel with the African Origins database. The project invites users to identify the likely backgrounds of nearly 100,000 Africans liberated from slave vessels based on their indigenous names. By combining those names with information from Voyages on liberated Africans’ ports of origin, the Origins website aims to better understand the homelands from which enslaved people came.
Through these endeavors, Voyages has become a digital memorial to the millions of enslaved Africans forcibly pulled into the slave trade and, until recently, nearly erased from the history of not only the trade itself, but also the history of the Atlantic world.
Philip Misevich is an assistant professor of history, St. John’s University ; Daniel Domingues is an assistant professor of history, University of Missouri-Columbia ; David Eltis is a professor emeritus of history, Emory University ; Nafees M. Khan is a lecturer in social studies education, Clemson University , and Nicholas Radburn is a postdoctoral fellow at the University of Southern California – Dornsife College of Letters, Arts and Sciences
Support Provided By: Learn more
Educate your inbox
Subscribe to Here’s the Deal, our politics newsletter for analysis you won’t find anywhere else.
Thank you. Please check your inbox to confirm.

- Division of Social Sciences
- Social Sciences Book Gallery
Home » The Slave Voyages Database
The Slave Voyages Database

The Slave Voyages Database is the most prominent public-facing project on the history of the slave trade and one of the most dynamic sites of research in slavery studies. It was launched under its former name “Transatlantic Slave Trade Database” in 1999 as a CD ROM and migrated online in 2008. A revolutionary tool for scholars since its inception, it has received renewed public attention in the wake of the U.S.’s 1619 anniversary.
A consortium has been formed to collaborate on relaunching elements of the project and providing long-term sustainability. UC Berkeley joins our colleagues at UC Irvine and UC Santa Cruz organizing this on behalf of the University of California. Along with the University of California, other consortium members are Rice University, Emory University, the Hutchins Center at Harvard University, the National Museum of African American History and Culture, and the Omohundro Institute of Early American History and Culture.
Those at UC Berkeley interested in learning more about the Database and opportunities for collaboration should be in contact with G. Ugo Nwokeji ([email protected]), Associate Professor of African American Studies and Elena Schneider ([email protected]), Associate Professor of History.
We thank Dean Raka Ray of the College of Letters and Science, Social Sciences Division for her office’s support for UC Berkeley’s financial contribution to this consortium.
To learn more and access the database, visit https://www.slavevoyages.org/ .
To learn more about the consortium, see https://news.emory.edu/features/2021/03/voyages-consortium/index.html.
Documenting Slave Voyages
Led by Emory, a massive digital memorial shines new light on one of the most harrowing chapters of human history

Published in The Illustrated London News on June 20, 1857, this image depicts the capture of the slave ship "Zeldina" and the conditions of the enslaved people who were onboard. Reproduced courtesy Emory's Rose Library.
For African American families seeking clues to their ancestry, the task is too often stymied by a history that defies documentation.
In fact, the drive toward discovery frequently ends abruptly with the scant record-keeping that surrounds the American slave trade — people kept as property with names simply lost to history.
So when Henry Louis Gates Jr. works with guests on the acclaimed PBS program “ Finding Your Roots ” whose family stories have been obscured by slavery, he routinely looks for clues in Emory University’s “Slave Voyages: The Transatlantic Slave Trade Database .”
“And it’s a gold mine,” says Gates, director of the Hutchins Center for African and African American Research at Harvard University — an early supporter of the Slave Voyages project — who calls it “one of the most dramatically significant research projects in the history of African studies, African American studies and the history of world slavery itself.”
When the Washington Post recently covered the 400th anniversary of the arrival of the first known enslaved Africans upon “Jamestown’s muddy shores” in colonial Virginia, the article relied upon maps and chart data sourced directly from Emory’s Slave Voyages database to help illustrate a moment that would open centuries of subjugation for millions of people.
And when work began on a new International African American Museum in Charleston, South Carolina, curators knew they could turn to Slave Voyages for definitive data on the slave trade that once ran through the very site of the project, Gadsden’s Wharf — once a point of entry for nearly half of all slaves brought to the U.S.
Ten years ago, when Emory created a website dedicated to data that provided a broader, more complete portrait of the trans-Atlantic slave trade, there was nothing quite like it in the world.
Today, the updated and expanded database has become one of the most utilized resources in the digital humanities.
Recognized as a preeminent resource for the study of slavery across the Atlantic, the project has won acclaim for consolidating data from archival resources across five continents, unifying diverse threads of scholarship, and shining new light upon a harrowing chapter of human history.
“If there were a Pulitzer Prize given for historical databases, the Transatlantic Slave Trade Database would win it, hands down,” says Gates, Alphonse Fletcher University Professor at Harvard.
“It’s the first time in the history of human enslavement that scholars have been able to count the enslaved human beings trapped in the nightmare of human bondage.” — Henry Louis Gates Jr.

New website showcases new data
With a focus on advancing public scholarship and collaboration, the newly redesigned site can attract more than 1,000 visitors a day, including educators, scholars, scientists, artists, genealogists and curators with national museums and history centers.
But cataloguing data covering more than three centuries of voyages from Africa to the New World — among the largest slave routes in human history — captured only part of the picture.
Once across the Atlantic, up to 20 percent of enslaved Africans were then dispatched on yet another voyage to their final destinations within the Americas, from Boston to Buenos Aires, even Pacific ports or hundreds of miles inland, especially in Brazil.
Now, with support from the National Endowment of the Humanities, The Andrew W. Mellon Foundation and the United Kingdom’s Arts and Humanities Research Board, a team of international scholars — many with Emory roots — has partnered with Emory’s Center for Digital Scholarship (ECDS) to update and expand slavevoyages.org.
Hear Harvard professor Henry Louis Gates Jr., host/producer of the PBS series “Finding Your Roots," discuss the impact of the redesigned SlaveVoyages.org.
Significantly, the redesign incorporates a trove of new data on the lesser-explored intra-American slave trade, effectively redrawing the map of slavery throughout the Americas and opening staggering new vistas of research.
“The trans-Atlantic slave trade marked the largest long-distance coerced movement of people in history and, prior to the mid-nineteenth century, formed the major demographic well-spring for the re-peopling of the Americas,” notes Emory historian David Eltis, Robert W. Woodruff Professor Emeritus of History and co-director of the Slave Voyages project.
From the late fifteenth century, the Atlantic Ocean became a “commercial highway” that integrated the histories of Africa, Europe and the Americas for the first time. And slavery and the slave trade formed the linchpins of the process, Eltis says.
Visitors to the website can now explore the involvement of the entire Atlantic world in the slave trade, histories of regions, the relationship between slavery and freedom, commercial factors that supported the slave trade, and why it came to an end, he says.
“There isn’t a single port of any size anywhere in the Atlantic that wasn’t connected to the slave trade in some way,” he says. “Now, we can track systematic connections between Africa and the Americas in a way that people have been doing for years between Europe and the Americas.”
Bringing history to life through big data

Mapping history: See 14,289 slave voyages cross the Atlantic in a few minutes, or hone in on specific years, by viewing the full timelapse video on SlaveVoyages.org.
The Slave Voyages site now provides resources detailing more than 36,000 slave trading voyages between Africa and the New World, another 11,400 intra-American voyages from one part of the Americas to another, and data on some 92,000 Africans forced to make those journeys.
A smoother, expanded user experience features even more data about those voyages, identifying specific slave vessels — along with those who sailed them — route maps and timelines, as well as the names of many enslaved Africans.
The result? Consolidated information that reveals patterns and connections once obscured by barriers of language and geography.

The databases on SlaveVoyages.org are the culmination of several decades of independent and collaborative research by scholars drawing upon data in libraries and archives around the Atlantic world.
Interactive features allow users to analyze a vast volume of data, sample estimates of the slave trade, view videos, maps and 3-D animation, consult research essays and lesson plans, and contribute new discoveries, says Gates, who narrates an introductory video to the site.
Animated maps trace the routes of more than 14,000 slave voyages across the Atlantic in minutes. And a sweeping new 3D video provides both a drone’s-eye-view and a fly-through of the 18 th -century slave vessel L’Aurore, reproduced from original architectural plans.
For the first time, visitors can see how enslaved men and women were physically separated, how they were shackled and packed together like cargo to sleep, and explore the cramped, cruel spaces that the ship’s approximately 600 captives had to endure on their two-month passage from Africa to the Caribbean.
In the future, the website will afford an even more complete picture, with expanded biographical data on individuals caught up in the slave trade, both the enslaved and their enslavers. The initiative, People of the Atlantic Slave Trade (PAST) , is funded by a grant from The Andrew W. Mellon Foundation .
Features that will add both details and dimension to the story of slavery in the Americas — a history now brought to life through the power of big data.
Take a 3-D look inside the slave vessel L'Aurore, reconstructed using actual blueprints of the ship. Get a glimpse here, or watch the full video on SlaveVoyages.org.

Emory historian David Eltis has overseen the database's transition from punch cards to CD-ROM to today's interactive website.
The vision behind ‘Slave Voyages’
For years, the vast, collaborative scope of the Slave Voyages project has been nurtured and guided by Eltis, who envisioned a resource rooted in shared scholarship.
In the early 1960s, when he was an undergraduate, slavery was just emerging as an academic discipline, still considered “a fringe topic” among most historians, recalls Eltis.
However, its study would be advanced through the trailblazing scholarship of American historian Philip Curtin, one of the first researchers to estimate the number of enslaved Africans to cross the Atlantic between the 16th and 19 th centuries, where they were captured, how many perished during the Middle Passage and where they disembarked.
Though his projections are now considered low by today’s estimates, the work was groundbreaking. It also established what would become the nascent beginning of a database, which Curtin eventually shared with Eltis.
But with voyages that embarked on one continent and ended on another, “there were so many different kinds of records, thousands of miles apart across the Atlantic world,” Eltis recalls.
Development of a single, multi-source dataset was kindled by fate, when Eltis happened to meet historian Stephen Behrendt while waiting in line at the British Public Record Office in 1990. The project was quickly enriched by the collaborative scholarship of historian David Richardson, former director of the Wilberforce Institute for the Study of Slavery and Emancipation at the University of Hull, in Yorkshire, England.
Over time, the data grew and evolved with advancing technology. Eltis would oversee its migration from punch cards to laptop computer to “The Transatlantic Slave Trade,” a CD-ROM released in 1999 with the backing of a grant from the National Endowment of the Humanities showcasing maps and data on more than 27,000 slave voyages.
But the format carried limitations, and Eltis knew they were missing an important chapter.
“The big hole was the South Atlantic trade,” he acknowledges.
"The trans-Atlantic slave trade was the largest long-distance coerced movement of people in history."
— emory historian david eltis.

Titled "Ménagerie," this engraving from 1667 illustrates enslaved people processing tobacco in the yard of a large farm or plantation. A copy of the image is housed at the John Carter Brown Library of Brown University.

Historical images: The Brig “Vigilante” was a French slaver captured in 1822. She departed from France and carried 345 slaves from the coast of Africa, but she was intercepted by anti-slave trade cruisers before sailing to the Americas and taken to Freetown, Sierra Leone. Learn more about the Viglante on SlaveVoyages.org.
International collaboration
By 2008, the database found a home at Emory as a free, open-access website examining the forced migration of enslaved Africans across the Atlantic world.
From its inception, collaboration has been a hallmark of the project, which encourages researchers to contribute their own new discoveries and correct errors, Eltis says.
For the past five years, for example, Marial Iglesias Utset, a historian of the Cuban slave trade and visiting research scholar at the Afro-Latin American Research Institute at Harvard’s Hutchins Center, has worked closely with Eltis to add the numbers of Africans sent to Cuba, consulting the site almost daily.
In fact, Eltis finds it difficult to identify an international project devoted to preserving and reconstructing history that has been more dependent upon collaboration — a model foundational to future growth.
Across the years, the database has been guided by a multi-disciplinary team of international scholars and historians, librarians, cartographers, computer programmers, designers and digital experts. Now a major digital publishing project, the website is physically tended by ECDS, which manages logistics, coding and technical support.
“This involves some of the newest technology applied to some of the world’s oldest questions and primary sources,” says ECDS Co-Director Allen Tullos, Emory history professor and senior editor of Southern Spaces .
“How did the Spanish, the British and the Dutch engage in larger questions of slavery, forced migration and colonialism? Now you can look at maps, charts and tables that provide a broader picture of history across centuries, making big comparisons across time and space.”
For Tullos and the ECDS team, helping redesign and relaunch the website has been an opportunity “to really contribute to knowledge about some of the worst dimensions of human history, bringing this information forward so it won’t be forgotten.”
Scholars who once studied with David Eltis at Emory have become the next generation of slave trade researchers

‘A landmark of crowd-sourcing’
Over the past decade, primary responsibility for supporting the site has been shouldered by Emory. But to help ensure sustainability, a new consortium of universities is coming together to help maintain the site, update it and guide it for future generations.
Each Monday, behind-the-scenes collaborators connect across multiple time zones for weekly Skype meetings. Many are alumni of Emory’s Laney Graduate School, PhD students who once studied with Eltis, now emerging as the next generation of slave trade scholars.
“It’s been an amazing example of generosity and collegiality, a passing of the baton,” notes Tullos.

Meet the next generation of scholars: Nafees Khan, an assistant professor of social foundations at Clemson University, holds a PhD in educational studies from Emory.
Take, for example, Nafees Khan, an assistant professor of social foundations at Clemson University who holds a PhD in educational studies from Emory and now serves as the project’s curriculum advisor, helping others teach about slavery.
His work ranges from creating lesson plans for grade school teachers to consulting on the development of the new International African American Museum in Charleston.
“Any time I present this information, the interaction has been meaningful — for many, this is so new,” Khan says. “When it comes to the legacies of race, it’s definitely pushed the conversation.”

Meet the next generation of scholars: Alex Borucki, who also earned his PhD at Emory, is now associate professor of history at University of California – Irvine.
Much of the new intra-American slave trade data arose from the research of Emory PhD alumnus Alex Borucki, associate professor of history at University of California Irvine, and Greg O’Malley, associate professor of history at University of California Santa Cruz.
“Through the scope of international collaboration, you find yourself working with people from every corner of the world,” Borucki says. “It’s been a landmark of crowd-sourcing and longstanding research collaboration, and also of trust between research teams.”

Meet the next generation of scholars: Emory PhD alumnus Daniel Domingues da Silva is assistant professor of African history at Rice University and a Voyages executive board member.
Since the database was first published, Eltis credits the contributions of more than 50 scholars and researchers. Ongoing discoveries help make the database feel organic, “in the sense that it’s always growing,” says Emory PhD alumnus Daniel Domingues da Silva, assistant professor of African history at Rice University and Voyages executive board member.
Now, Voyages is being replicated, inspiring similar projects around the world.
Gates points to scholarship in England directed by historian Catherine Hall, who is compiling data about the practice of compensating slaves owners — but not enslaved Africans — for the loss of “property” when slavery was abolished in the British colonies in 1833.

Meet the next generation of scholars: Jane Hooper earned her PhD at Emory and is now associate professor of history at George Mason University and a Voyages executive team member.
Or consider the work of Emory PhD alum Jane Hooper, associate professor of history at George Mason University and a Voyages executive team member, who researches the Indian Ocean slave trade, which substantially predates the trans-Atlantic trade and lasted much longer.
Using the Slave Voyages model — scholars working together, sharing data — the International Institute of Social History in Amsterdam is now in talks to create a similar database examining slave trade in the Indian Ocean and maritime Asia.
European colonizers turned to Africa for enslaved laborers to build the cities and extract the resources of the Americas, forcing millions of Africans across the Atlantic to the Americas.
— slavevoyages.org.

"Cutting the Sugar-Cane," an image originally published in 1833 by the Infant School Society Depository in London. Original housed in the John Carter Brown Library of Brown University.
Understanding the scope of the slave trade
Why is it so important to preserve and understand this data?

Register from The Brigantine "Virtude": The register was kept as a formal record of emancipation that helped protect people from subsequent re-enslavement. The image is reproduced courtesy of the British National Archives and is one of many catalogued on SlaveVoyages.org .
"The contributions of this website to the self-knowledge of African Americans, not just in the U.S. but throughout the New World, cannot be overestimated," Gates says.
When an African American guest on "Finding Our Roots" receives their African admixture results from DNA testing, which tells them the various regions that their collective black ancestors came from in Africa, his team then compares those results to statistics in the database.
"For example, if a DNA test says 20 percent of their ancestors came from what is now Angola, we then see what ships were coming in to the U.S. from Angola at about the time we estimate their ancestor might have arrived," he explains.
As importantly, it helps enlighten a public that still doesn’t always grasp the massive scope of forced human migration.
“I speak all over the country about genealogy, genetics and the slave trade," Gates says. "My favorite rhetorical device is to ask the audience ‘How many Africans were shipped directly from Africa to the United States?’”
“We know 12.5 million Africans got on the boats, 10.8 million Africans survived the Middle Passage and got off boats throughout the New World,” Gates says.
The guesses roll in: 2 million, 5 million — all wrong.
“The answer is 388,000 — no one can believe it,” he adds. “And we didn’t know this for sure, this surprisingly counter-intuitive fact, until David Eltis and David Richardson compiled the statistics in the Transatlantic Slave Trade Database.”
It’s remarkable, illustrating how much is still misunderstood about the slave trade, “because we as Americans were raised to think that slavery was all about us … In point of fact, Haiti, Cuba and Brazil got many, many more Africans in the slave trade than the United States did,” he says.
Frustrated by reading wildly fluctuating estimates of African captives shipped through the trans-Atlantic slave trade in the New York Times, Gates recently wrote Editor-in-Chief Dean P. Baquet asking him to establish as official policy the authority of the Transatlantic Slave Trade Database’s numbers.
And he agreed, Gates says.
“Now, if you read an article in the Times and it will say that approximately 12.5 million Africans were shipped to the New World, it’s by the authority of Transatlantic Slave Trade Database,” he says. “It’s all because of David (Eltis) and his colleagues.”
ABOUT THIS STORY:
Written by Kimber Williams. Videos courtesy of SlaveVoyages.org and the Emory Center for Digital Scholarship. Historical images courtesy of SlaveVoyages.org. Photos of researchers by Kay Hinton. Design by Elizabeth Hautau Karp and Laura Douglas-Brown.
Want to know more?
Please visit the emory news center and emory university ..

The Transatlantic Slave Trade Database
Some 12.5 million Africans were taken from their homes and forced aboard slave ships that were destined for the New World. About 10.7 million people survived the horrors of the Middle Passage between 1526 and 1866, only to end up in bondage on sugar, rice, cotton, and tobacco plantations throughout the Americas and the Caribbean.
The transatlantic slave trade is the largest forced migration in history. Until recently, however, it was all but impossible to measure the trade’s true dimensions: There were simply too many records among too many geographically dispersed archives. But, today, the slave trade’s broad outlines and its subtler trends can be gauged because of a remarkably collegial and tech-savvy project called the Trans-Atlantic Slave Trade Database.
The database was born in 1990 in the British Public Records Office, when two scholars struck up a conversation about their respective projects. David Eltis, who is now the Robert W. Woodruff Professor of History at Emory University, was gathering data on the early history of the British slave trade. Stephen Behrendt, who teaches at the Victoria University of Wellington in New Zealand, was doing the same for its later years. They decided to combine their efforts to create a collaborative platform for further scholarship.
With $1,025,644 from NEH and help from the W. E. B. DuBois Institute for African and African American Research at Harvard University, Eltis and Behrendt were soon consolidating the data that they and many other historians had spent years culling from tax registers, port books, captains’ logs, private letters, and a myriad of other documents. They released the first edition of the database on CD-ROM in 1999 and, after integrating a wave of new information, launched an open-access website called Voyages in 2008. To date, the database includes data from 57 contributors, reflecting 34,948 voyages—an estimated 66 to 80 percent of all slaving expeditions to cross the Atlantic during the trade’s three-and-a-half centuries.
The real strength of the database, however, lies less in its grand totals than in the smaller patterns that emerge. Each record contains fields for a voyage’s milestone dates (departure, landings, return), rigging, captain’s name, places of slave purchase and sale, number of slaves embarked and disembarked, and so on. These kinds of details allow for more focused counts, which, in turn, raise more substantive questions: What can the data tell us, for example, about the dynamics of shipboard rebellions? About the origins of American rice culture? Or about the ancestry of Cuba’s slave population?
One of the first online databases to embrace crowdsourcing for the collection and correction of information, the database continues to evolve with the times. The project team is currently working to add the latest vetted data and recode the Voyages website, incorporating a foreign language capability and dynamic mapping features.
Written by James Williford, a writer in Washington, D.C.
Image Credit: Library of Congress
More Projects

Online State Encyclopedias

The Papers of George Washington

Patient Health through Narrative Medicine

Walters Art Museum Digitization Project
FOLLOW @nehgov

The National Endowment for the Humanities is an independent federal agency that supports research and learning in history, literature, philosophy, and other areas of the humanities by funding selected, peer-reviewed proposals from around the nation. Additional information about the National Endowment for the Humanities and its grant programs is available at: www.neh.gov .
National Endowment for the Humanities 400 7th Street SW Washington, DC 20506 1-800-NEH-1121 202-606-8400 [email protected]
Articles & Databases
Explore our collection of hundreds of online resources and databases. Use our free online content to help with your research, whether it's finding a single article, tracing a family tree, learning a new language, or anything in between.
.css-1t84354{transition-property:var(--nypl-transition-property-common);transition-duration:var(--nypl-transition-duration-fast);transition-timing-function:var(--nypl-transition-easing-ease-out);cursor:pointer;-webkit-text-decoration:underline;text-decoration:underline;outline:2px solid transparent;outline-offset:2px;color:var(--nypl-colors-ui-link-primary);text-decoration-style:dotted;text-decoration-thickness:1px;text-underline-offset:2px;}.css-1t84354:hover,.css-1t84354[data-hover]{-webkit-text-decoration:underline;text-decoration:underline;color:var(--nypl-colors-ui-link-secondary);text-decoration-style:dotted;text-decoration-thickness:1px;}.chakra-ui-dark .css-1t84354:hover:not([data-theme]),.chakra-ui-dark .css-1t84354[data-hover]:not([data-theme]),[data-theme=dark] .css-1t84354:hover:not([data-theme]),[data-theme=dark] .css-1t84354[data-hover]:not([data-theme]),.css-1t84354:hover[data-theme=dark],.css-1t84354[data-hover][data-theme=dark]{color:var(--nypl-colors-dark-ui-link-secondary);}.css-1t84354:focus,.css-1t84354[data-focus]{box-shadow:var(--nypl-shadows-outline);}.chakra-ui-dark .css-1t84354:not([data-theme]),[data-theme=dark] .css-1t84354:not([data-theme]),.css-1t84354[data-theme=dark]{color:var(--nypl-colors-dark-ui-link-primary);}.css-1t84354:visited{color:var(--nypl-colors-ui-link-tertiary);}.chakra-ui-dark .css-1t84354:visited:not([data-theme]),[data-theme=dark] .css-1t84354:visited:not([data-theme]),.css-1t84354:visited[data-theme=dark]{color:var(--nypl-colors-dark-ui-link-tertiary);}.css-1t84354 a:hover,.css-1t84354 a[data-hover]{color:var(--nypl-colors-ui-link-secondary);}.css-1t84354 screenreaderOnly{clip:rect(1px, 1px, 1px, 1px);height:1px;overflow:hidden;position:absolute!important;width:1px;word-wrap:normal;} Slave Voyages (The Trans-Atlantic and Intra-American slave trade)
This digital memorial raises questions about the largest slave trades in history and offers access to the documentation available to answer them. European colonizers turned to Africa for enslaved laborers to build the cities and extract the resources of the Americas. They forced millions of mostly unnamed Africans across the Atlantic to the Americas, and from one part of the Americas to another. Analyze these slave trades and view interactive maps, timelines, and animations to see the dispersal in action.
Toggle Sidebar
IMAGES
COMMENTS
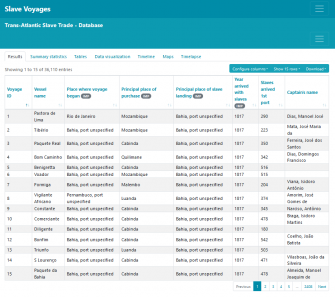
Search for information on 36,000 trans-Atlantic slave voyages and 10,000 intra-American ventures from 1514 to 1866. Explore the data by year, place, vessel, captain, and more with maps, timeline, and timelapse features.
The database includes the name, age, gender, and places of embarkation and disembarkation of each individual. Drawing on extensive archival records, this digital memorial allows analysis of the ships, traders, and captives in the Atlantic slave trade. The three databases below provide details of 36,000 trans-Atlantic slave voyages, 10,000 intra ...
Drawing on extensive archival records, this digital memorial allows analysis of the ships, traders, and captives in the Atlantic slave trade. The three databases below provide details of 36,000 trans-Atlantic slave voyages, 10,000 intra-American ventures, names and personal information. You can read the introductory maps for a high-level guided explanation, view the timeline and chronology of ...
Explore the online database of 35,000 slave ship crossings from Africa to the Americas from the 16th to the 19th century. Find records of voyages, maps, images, and names of 67,000 liberated Africans.
Explore over 130,000 voyages of the slave trade in the Atlantic world from 1492 to 1866. Search, filter, sort, and visualize data by various variables, and access image galleries and African names database.
Explore the online database of nearly 36,000 slave voyages that occurred between 1514 and 1866. Search, analyze and contribute data on the largest forced migration in human history and its impact on the Atlantic world.
Download the 2019 version of the database with 36,002 voyages and 274 variables, or access earlier versions and a codebook. The database contains historical records of the transatlantic slave trade from Africa to the Americas.
To date, the database includes data from 57 contributors, reflecting 34,948 voyages—an estimated 66 to 80 percent of all slaving expeditions to cross the Atlantic during the trade's three-and-a-half centuries. The real strength of the database, however, lies less in its grand totals than in the smaller patterns that emerge.
Track the journeys of over 10-12.5 million Africans forced into slavery with this searchable database of passenger records from 36,000 trans-Atlantic slave ship voyages. Subscribe to receive the latest news and updates from the National Endowment for the Humanities. Edsitement!
SlaveVoyages is the world's largest archive of data related to the trans-Atlantic and intra-American slave trades. This database includes data on over 30,000 British, French, and Dutch ships that forced roughly 12 million Africans across the Atlantic between the 16th -19th centuries as well as data on hundreds of thousands of enslaved peoples that were trafficked within the Americas.
Search for names of African captives in the trans-Atlantic and intra-American slave trades. Explore the digital memorial with maps, timeline, animations and archival records.
Explore the databases, images, essays, and animations of the Transatlantic Slave Trade Database, a NEH-funded project that documents the voyages of enslaved people. Reflect on the challenges of historical research and representation of slavery and its impact on individuals and societies.
Voyages is a project that collects and analyzes data on over 35,000 slave voyages from 1501 to 1867. It provides information on the origins, destinations, numbers, and mortality of enslaved Africans in the Atlantic trade.
A comprehensive online resource on the history and data of the transatlantic slave trade, created by David Eltis and David Richardson. Explore information on 35,000 voyages, 90,000 Africans, and the intra-American traffic.
Slave Voyages documents the history of the transatlantic slave trade and forced migration of millions of people from Africa to the Americas between 1514 and 1866. The site is geared toward scholars, educators, and students and is made up of three main databases. The Transatlantic Slave Trade Database details 36,000 slaving voyages from archival ...
Learn how the database was created, what data it contains, and how it can be used for historical research. Explore the maps, timeline, animations, and names of the slave trade and its impact on the Atlantic world.
To document this enormous trade - the largest forced oceanic migration in human history - our team launched Voyages: The Trans-Atlantic Slave Trade Database, a freely available online resource ...
A project on the history of the slave trade and slavery studies, launched in 1999 and relaunched by a consortium of universities. Visit the website to access the database and learn more about the consortium.
Slave Voyages. Led by Emory, a massive digital memorial shines new light on one of the most harrowing chapters of human history. For African American families seeking clues to their ancestry, the task is too often stymied by a history that defies documentation. In fact, the drive toward discovery frequently ends abruptly with the scant record ...
To date, the database includes data from 57 contributors, reflecting 34,948 voyages—an estimated 66 to 80 percent of all slaving expeditions to cross the Atlantic during the trade's three-and-a-half centuries. The real strength of the database, however, lies less in its grand totals than in the smaller patterns that emerge.
The Intra-American Slave Trade Database contains information on approximately 10,000 slave voyages within the Americas. The African Names Database provides personal details of 91,491 Africans taken from captured slave ships or from African trading sites. It displays the African name, age, gender, origin, country, and places of embarkation and ...
Drawing on extensive archival records, this digital memorial allows analysis of the ships, traders, and captives in the Atlantic slave trade. The three databases below provide details of 36,000 trans-Atlantic slave voyages, 10,000 intra-American ventures, names and personal information. You can read the introductory maps for a high-level guided explanation, view the timeline and chronology of ...
Drawing on extensive archival records, this digital memorial allows analysis of the ships, traders, and captives in the Atlantic slave trade. The three databases below provide details of 36,000 trans-Atlantic slave voyages, 10,000 intra-American ventures, names and personal information. You can read the introductory maps for a high-level guided explanation, view the timeline and chronology of ...